Scored using Graphics cards Methodology v3.0
Graphics cards Methodology v3.0
Mathematical & Unbiased Scoring
Products in this category are scored under Frontum Graphics cards Methodology v3.0: the technical score from the specifications is the base, and independent expert and video reviews (up to ±0.5 points), owner opinions (up to ±0.3) and best-of lists (up to +0.3) move it up or down.
Explore Graphics cards Methodology v3.0

AMD Radeon RX 6650 XT Review: 117 Specs Compared

Avg. price:~$250VRAM:8 GBMemory bus width:128 bitThermal Design Power (TDP):176 W

AMD Radeon RX 6650 XT Review: Compare 117 technical specifications, 32 expert and video reviews, 187 owner opinions and 1 best-of list to see how this product ranks in the Graphics cards category and whether it is worth buying.
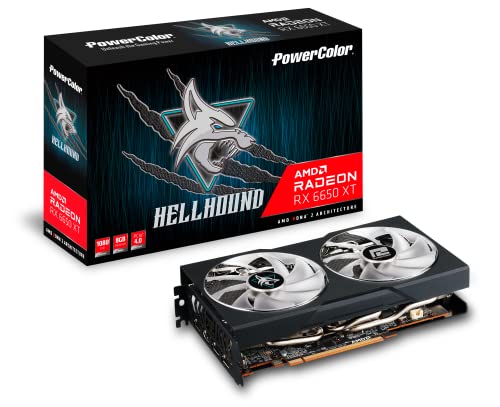
AMD Radeon RX 6650 XT
6.2/10

Overall score

Score
6.2/ 10
✕
What it is
Our main score for this model, 1–10. It combines specs, expert reviews, best-of lists and owners.
How we count it
Parts: Technical score 40%, Reviews score 25%, List score 25%, Sentiment score 10%
Marks: Each part gets a mark out of 10. For reviews, lists and owners, a typical model in this category gets about 8 and the best one gets 10.
No data yet: A part with no data shows "?". It counts as the mark of a weaker model in this category (4 in 5 models with data score higher). This way, models with reviews, lists and owners usually come out ahead.
Score distribution
▼
<55-66-77-88-99-10
Score components

40%

6.2

Technical Score

25%

6.2

Reviews score

25%

6.2

List score

10%

6.2

Sentiment score

▼Worse than 83% of graphics cards
7.1

Ratio quality/price

Ratio quality/price
7.1/ 10
✕
What it is
An indicator that combines the graphics card's overall rating with its cost.
When it matters
When you are looking for a graphics card that offers a strong balance of performance, features, and price.
Score distribution
▼
<55-66-77-88-99-10
Score components

70%

6.2

Overall score

30%

9.2

Price

▼Worse than 67%
6.2

Technical Score

Technical score
6.2/ 10
✕
What it is
How good the specs are compared with the other models in this category, 1–10.
How we count it
Areas: We rate the specs in each area against the other models in this category.
Weighting: The areas that matter most to buyers count more. The shares are shown under Score components.
Share: The technical score is 40% of the overall score.
Score distribution
▼
<55-66-77-88-99-10
Score components

44%

5.6

Performance

24%

4.0

Memory

12%

8.2

Power

11%

8.9

Features

5%

9.3

Design

4%

9.2

Connectivity

▼Worse than 65%
6.2

Reviews score

Reviews score
6.2/ 10
✕
What it is
Average grade from independent test sites, magazines and video reviewers, 1–10.
How we count it
Grades: Each review's own score is converted to 1–10; without one, we grade the review ourselves. Big test sites count more, short reviews half as much as full tests. A video review counts half.
Score: The average grade is 80% of the review mark; the number of reviews is the other 20% (1 review = 5, the typical number in this category = 8, the most-reviewed model = 10).
Enough data: With few reviews, the average grade is pulled toward the typical grade of this category. No reviews yet: 7.6 for now.
Share: Reviews count 25% of the overall score.
Score distribution
▼
<55-66-77-88-99-10

6.2

Mark 7.9 is below the typical mark 8.0 of this category, so it cannot lift the score above the technical score

80%

7.6

Average grade

20%

9.2

Popularity

Grades by review (32)
15 reviews: 6 with a printed score, 9 estimated from the review. 17 video reviews, each counting half as much as a written test. Reviews count 25% of the overall score.
User ratings collected online are not part of this score.
▼Worse than 81%
6.2

Sentiment score

Sentiment score
6.2/ 10
✕
What it is
How positive owners are about this model in their comments under video reviews and on forums. We read each comment, keep only people who say they own the model, and sort them into positive, mixed or negative.
How we count it
Score: We compare how satisfied this model’s owners are with the other models in this category: the typical model gets 8, the most satisfied tenth 10, the least satisfied 4. This is 80% of the owner mark; the number of owners is the other 20%.
Enough data: A model counts with 10+ owners from 4+ different discussions. With fewer, the owner part counts as 7.8 for now.
Share: Owners count 10% of the overall score (left out in categories where fewer than 10 models have enough owner comments).
Score distribution
▼
<55-66-77-88-99-10

6.2

Mark 7.2 is below the typical mark 8.2 of this category, so it cannot lift the score above the technical score

80%

7.0

Satisfaction

20%

7.9

Popularity

Owners (187)
187 owners from 19 online discussions
55% positive
20% mixed
26% negative
Category average: 73% positive
Our own analysis of online owner opinions, not a rating from any website.
▼Worse than 83%
6.2

List score

List score
6.2/ 10
✕
What it is
How often independent test sites, magazines and video reviewers put this model in their best-of lists for this category.
How we count it
Points: The model in the most lists of this category gets 10; the others get 8 to 10 in proportion. In no list yet: 7.5. Lists count 25% of the overall score.
Enough data: Every list counts, even a single one. With fewer than 5 best-of lists in the category, this part is left out.
Lists with this model (1)
List score: in 1 of 95 lists (1%)
▲Better than 89%
  • amd-radeon-rx-6650-xt
  • amd-radeon-rx-6650-xt
  • amd-radeon-rx-6650-xt
  • amd-radeon-rx-6650-xt
  • amd-radeon-rx-6650-xt
  • amd-radeon-rx-6650-xt
amd-radeon-rx-6650-xt
Where to Buy
*As an Amazon Associate, we earn from qualifying purchases.
Best Rankings
Available: ranking among products currently available (including other versions of this product).All: ranking among all products in the database.

What Reviewers Say About the AMD Radeon RX 6650 XT

Based on 15 · 18

Reviewers like the quiet cooling and solid value, but agree ray tracing is weak and the gain over its predecessor is small.
Praised
Mixed views
Criticised
Pick a topic to see who said what

What owners say about the AMD Radeon RX 6650 XT

Based on 187 owners sharing their experience in online comments

55%positive19%mixed26%negative

Owners mostly like its strong 1080p performance, while stuttering, driver problems, and weak ray tracing are recurring frustrations.

What owners dislike

  • Some owners report stuttering, lag spikes and sudden frame drops in games such as Fortnite, GTA V and Warzone, often on Ryzen 5 chips.25
  • Some owners report frame rates well below expectations in certain games, sometimes much lower than benchmarks suggest.20
  • Some owners say the card runs hotter than expected, with hotspot temperatures reaching 90 to 100 degrees Celsius on some models.8
  • Owners say ray tracing performance is weak, with large frame rate drops when RT is turned on.5
  • Owners say 8 GB of VRAM feels limiting at 1080p in newer games and sometimes runs out of memory.5
  • Some owners say driver installs caused system problems, such as a GPU that stopped working or the error Code 43.4
  • Some owners say GPU usage drops to very low levels during gameplay, causing stutters despite high CPU use.3
  • Owners say the H.264 encoder used for streaming gives poor video quality compared with Nvidia's encoder.3

Points mentioned by at least 3 owners, most mentioned first.

Loading...
Loading category ranking...

Technical Specifications of Graphics Card AMD Radeon RX 6650 XT

Technical Score
Technical score
6.2/ 10
✕
What it is
How good the specs are compared with the other models in this category, 1–10.
How we count it
Areas: We rate the specs in each area against the other models in this category.
Weighting: The areas that matter most to buyers count more. The shares are shown under Score components.
Share: The technical score is 40% of the overall score.
Score distribution
▼
<55-66-77-88-99-10
Score components:

44%

5.6

Performance

24%

4.0

Memory

12%

8.2

Power

11%

8.9

Features

5%

9.3

Design

4%

9.2

Connectivity

6.2
Reviews score
6.2
Sentiment score
6.2
List score
6.2
Ratio quality/price
Value for money
7.1/ 10
✕
What it is
An indicator that combines the graphics card's overall rating with its cost.
When it matters
When you are looking for a graphics card that offers a strong balance of performance, features, and price.
Score distribution
▼
<55-66-77-88-99-10
Score components:

70%

6.2

Overall score

30%

9.2

Price

7.1
3DMark Time Spy benchmark score
10,000 points
This graphics card scores 10,000 points in 3DMark Time Spy, which is lower than 70.7% of graphics cards and equal to 0.9% of graphics cards.
3DMark Port Royal score
5,543 points
This graphics card scores 5,543 points in 3DMark Port Royal, which is lower than 70.1% of graphics cards.
PassMark (G3D) result
17,145 points
This graphics card scores 17,145 points in PassMark G3D, which is lower than 68.2% of graphics cards and equal to 0.2% of graphics cards.
PassMark (DirectCompute) result
7,495 points
This graphics card scores 7,495 points in PassMark DirectCompute, which is lower than 73.4% of graphics cards.
FP32 performance
10.79 TFLOPS
This graphics card delivers 10.79 TFLOPS FP32 performance, which is lower than that of 72.4% of graphics cards and equal to that of 0.3% of graphics cards.
Show more
What reviewers say
VRAM
8 GB
This graphics card has 8 GB of VRAM, which is less than 56.8% of graphics cards and equal to 25.7% of graphics cards.
Memory type
GDDR6
This graphics card uses GDDR6 memory, which is newer than on 16.4% of graphics cards and equal to 40.3% of graphics cards.
Memory bus width
128 bit
This graphics card uses a 128 bit memory bus, which is narrower than that of 68.6% of graphics cards and equal to that of 26.7% of graphics cards.
Maximum memory bandwidth
280 GB/s
This graphics card reaches 280 GB/s memory bandwidth, which is lower than that of 76.6% of graphics cards and equal to that of 0.2% of graphics cards.
Effective memory speed
17,500 MHz
This graphics card reaches an effective memory speed of 17,500 MHz, which is slower than that of 60.5% of graphics cards and equal to that of 0.4% of graphics cards.
Show more
What reviewers say
PCI Express (PCIe) version
4
This graphics card supports PCIe 4, which is newer than on 22.5% of graphics cards and equal to 50.5% of graphics cards.
PCIe lanes
x8
This graphics card uses x8 PCIe lanes, which is fewer than 75.9% of graphics cards and equal to 22.9% of graphics cards.
DirectX version
12
This graphics card supports DirectX 12, which is older than on 81.8% of graphics cards and equal to 17% of graphics cards.
Vulkan version
1.3
This graphics card supports Vulkan 1.3, which is older than on 79.2% of graphics cards and equal to 15.6% of graphics cards.
OpenGL version
4.6
This graphics card supports OpenGL 4.6, which is more advanced than on 2% of graphics cards and equal to 98% of graphics cards.
Show more
What reviewers say
Max displays supported
4
This graphics card supports up to 4 displays, which is more than 9% of graphics cards and equal to 88.2% of graphics cards.
Max digital resolution
7680x4320
This graphics card supports a maximum digital resolution of 7680x4320, which is higher than that of 9.2% of graphics cards and equal to that of 90.9% of graphics cards.
DisplayPort outputs
3
This graphics card offers 3 DisplayPort outputs, which is more than 21.7% of graphics cards and equal to 76% of graphics cards.
DisplayPort version
1.4a
This graphics card supports DisplayPort 1.4a, which is more advanced than on 19.3% of graphics cards and equal to 46.3% of graphics cards.
DisplayPort link rates
8.1 Gbps
This graphics card supports DisplayPort link rates up to 8.1 Gbps, which is slower than on 65.3% of graphics cards and equal to 22.5% of graphics cards.
Show more
Thermal Design Power (TDP)
176 W
This graphics card has a TDP of 176 W, which is lower than that of 62.2% of graphics cards and equal to that of 0.2% of graphics cards.
Power consumption while under peak load
180 W
This graphics card draws 180 W under peak load, which is lower than 60.8% of graphics cards and equal to 4.6% of graphics cards.
Recommended PSU wattage
650 W
This graphics card recommends a 650 W PSU, which is lower than that of 39.2% of graphics cards and equal to that of 13.9% of graphics cards.
Board power limit
193 W
This graphics card has a board power limit of 193 W, which is lower than that of 58% of graphics cards.
PCIe power spec
75 W
Show more
What reviewers say
Size
225x 115x 37 mm
Length
240 mm
This graphics card is 240 mm long, which is shorter than 76.2% of graphics cards and equal in length to 1.5% of graphics cards.
Height
120 mm
This graphics card is 120 mm tall, which is shorter than 59.3% of graphics cards and equal in height to 5.3% of graphics cards.
Slot width
2 slot/s
This graphics card occupies 2 slot/s, which is slimmer than 52.4% of graphics cards and equal in width to 43.4% of graphics cards.
Weight
1.97 lb
This graphics card weighs 1.97 lb, which is lighter than 64.1% of Graphics cards and equal to 0.3% of Graphics cards.
Show more
What reviewers say

AMD Radeon RX 6650 XT vs the Average Graphics Card

246810TotalPerformanceMemoryFeaturesConnectivityPowerDesign
  • 5.2% higher boost clock speed
    This graphics card has a higher boost GPU clock than the average graphics card (2,635 MHz vs 2,505 MHz). The average graphics card has a boost GPU clock of 2,505 MHz.
    2,635 MHz vs 2,505 MHz
  • 25.1% faster VRAM clock
    This graphics card has a higher VRAM clock than the average graphics card (2,190 MHz vs 1,750 MHz). The average graphics card runs its VRAM at 1,750 MHz.
    2,190 MHz vs 1,750 MHz
  • 42.2 mm shorter card length
    This graphics card is shorter than the average graphics card (240 mm vs 282.2 mm). The average graphics card has a length of 282.2 mm.
    240 mm vs 282.2 mm
  • 0.5 slot/s slimmer design
    This graphics card occupies fewer slots than the average graphics card (2 slot/s vs 2.5 slot/s). The average graphics card occupies 2.5 slot/s.
    2 slot/s vs 2.5 slot/s
  • 7% higher base clock speed
    This graphics card has a higher base GPU clock than the average graphics card (2055 MHz vs 1920 MHz). The average graphics card has a base GPU clock of 1920 MHz.
    2,055 MHz vs 1,920 MHz
  • 18.1% lower TDP
    This graphics card has a lower TDP than the average graphics card (176 W vs 215 W). The average graphics card has a TDP of 215 W.
    176 W vs 215 W
  • More FP64 throughput
    This graphics card has a better FP64 ratio than the average graphics card (1:16 vs 1:64).
    1:16 vs 1:64
  • 8x more Infinity Cache
    This graphics card has more Infinity Cache than the average graphics card (32 MB vs 4 MB). The average graphics card has 4 MB Infinity Cache.
    32 MB vs 4 MB
  • 2x cheaper
    AMD Radeon RX 6650 XT is cheaper than the average graphics card ($250 vs $500).
    $250 vs $500
  • 5.2% higher boost clock speed
    This graphics card has a higher boost GPU clock than the average graphics card (2,635 MHz vs 2,505 MHz). The average graphics card has a boost GPU clock of 2,505 MHz.
    2,635 MHz vs 2,505 MHz
  • 7% higher base clock speed
    This graphics card has a higher base GPU clock than the average graphics card (2055 MHz vs 1920 MHz). The average graphics card has a base GPU clock of 1920 MHz.
    2,055 MHz vs 1,920 MHz
  • More FP64 throughput
    This graphics card has a better FP64 ratio than the average graphics card (1:16 vs 1:64).
    1:16 vs 1:64
  • 25.1% faster VRAM clock
    This graphics card has a higher VRAM clock than the average graphics card (2,190 MHz vs 1,750 MHz). The average graphics card runs its VRAM at 1,750 MHz.
    2,190 MHz vs 1,750 MHz
  • 8x more Infinity Cache
    This graphics card has more Infinity Cache than the average graphics card (32 MB vs 4 MB). The average graphics card has 4 MB Infinity Cache.
    32 MB vs 4 MB
  • 18.1% lower TDP
    This graphics card has a lower TDP than the average graphics card (176 W vs 215 W). The average graphics card has a TDP of 215 W.
    176 W vs 215 W
  • 66.7% lower idle power draw
    This graphics card has a lower idle power draw than the average graphics card (4 W vs 12 W). The average graphics card has an idle power draw of 12 W.
    4 W vs 12 W
  • 42.2 mm shorter card length
    This graphics card is shorter than the average graphics card (240 mm vs 282.2 mm). The average graphics card has a length of 282.2 mm.
    240 mm vs 282.2 mm
  • 0.5 slot/s slimmer design
    This graphics card occupies fewer slots than the average graphics card (2 slot/s vs 2.5 slot/s). The average graphics card occupies 2.5 slot/s.
    2 slot/s vs 2.5 slot/s
  • No CUDA support
    This graphics card does not support CUDA, the average graphics card does.
  • 4 GB less VRAM
    This graphics card has fewer VRAM than the average graphics card (8 GB vs 12 GB). The average graphics card has 12 GB VRAM.
    8 GB vs 12 GB
  • 1 fewer fans
    This graphics card has fewer fans than the average graphics card (2 vs 3).
    2 vs 3
  • No DLSS support
    This graphics card does not support DLSS, the average graphics card does.
  • 144 fewer AI cores
    This graphics card has fewer AI cores than the average graphics card (0 vs 144). The average graphics card has 144 AI cores.
    0 vs 144
  • 64 bit narrower memory bus
    This graphics card has a narrower memory bus than the average graphics card (128 bit vs 192 bit). The average graphics card has a memory bus width of 192 bit.
    128 bit vs 192 bit
  • Fewer PCIe lanes
    This graphics card has fewer PCIe lanes than the average graphics card (x8 vs x16). The average graphics card has x16 PCIe lanes.
    x8 vs x16
  • Less advanced frame generation
    This graphics card has less advanced frame generation than the average graphics card (frame generation vs multi frame generation).
    frame generation vs multi frame generation
  • 17.3% lower list score
    List score
    6.2/ 10
    ✕
    What it is
    How often independent test sites, magazines and video reviewers put this model in their best-of lists for this category.
    How we count it
    Points: The model in the most lists of this category gets 10; the others get 8 to 10 in proportion. In no list yet: 7.5. Lists count 25% of the overall score.
    Enough data: Every list counts, even a single one. With fewer than 5 best-of lists in the category, this part is left out.
    Lists with this model (1)
    List score: in 1 of 95 lists (1%)
    6.2 vs 7.5
  • 15.1% lower review score
    Reviews score
    6.2/ 10
    ✕
    What it is
    Average grade from independent test sites, magazines and video reviewers, 1–10.
    How we count it
    Grades: Each review's own score is converted to 1–10; without one, we grade the review ourselves. Big test sites count more, short reviews half as much as full tests. A video review counts half.
    Score: The average grade is 80% of the review mark; the number of reviews is the other 20% (1 review = 5, the typical number in this category = 8, the most-reviewed model = 10).
    Enough data: With few reviews, the average grade is pulled toward the typical grade of this category. No reviews yet: 7.6 for now.
    Share: Reviews count 25% of the overall score.
    Score distribution
    ▼
    <55-66-77-88-99-10

    6.2

    Mark 7.9 is below the typical mark 8.0 of this category, so it cannot lift the score above the technical score

    80%

    7.6

    Average grade

    20%

    9.2

    Popularity

    Grades by review (32)
    15 reviews: 6 with a printed score, 9 estimated from the review. 17 video reviews, each counting half as much as a written test. Reviews count 25% of the overall score.
    User ratings collected online are not part of this score.
    6.2 vs 7.3
  • 19.5% lower sentiment score
    Sentiment score
    6.2/ 10
    ✕
    What it is
    How positive owners are about this model in their comments under video reviews and on forums. We read each comment, keep only people who say they own the model, and sort them into positive, mixed or negative.
    How we count it
    Score: We compare how satisfied this model’s owners are with the other models in this category: the typical model gets 8, the most satisfied tenth 10, the least satisfied 4. This is 80% of the owner mark; the number of owners is the other 20%.
    Enough data: A model counts with 10+ owners from 4+ different discussions. With fewer, the owner part counts as 7.8 for now.
    Share: Owners count 10% of the overall score (left out in categories where fewer than 10 models have enough owner comments).
    Score distribution
    ▼
    <55-66-77-88-99-10

    6.2

    Mark 7.2 is below the typical mark 8.2 of this category, so it cannot lift the score above the technical score

    80%

    7.0

    Satisfaction

    20%

    7.9

    Popularity

    Owners (187)
    187 owners from 19 online discussions
    55% positive
    20% mixed
    26% negative
    Category average: 73% positive
    Our own analysis of online owner opinions, not a rating from any website.
    6.2 vs 7.7
  • 2.8% worse value for money
    AMD Radeon RX 6650 XT has worse value for money than the average graphics card (7.11 vs 7.3).
    7.11 vs 7.31
  • No CUDA support
    This graphics card does not support CUDA, the average graphics card does.
  • 144 fewer AI cores
    This graphics card has fewer AI cores than the average graphics card (0 vs 144). The average graphics card has 144 AI cores.
    0 vs 144
  • 56 fewer TMUs
    This graphics card has fewer TMUs than the average graphics card (128 vs 184). The average graphics card has 184 TMUs.
    128 vs 184
  • 8 fewer compute units
    This graphics card has fewer compute units than the average graphics card (32 vs 40). The average graphics card has 40 compute units.
    32 vs 40
  • 8 fewer ray tracing cores
    This graphics card has fewer ray tracing cores than the average graphics card (32 vs 40). The average graphics card has 40 ray tracing cores.
    32 vs 40
  • 52.3% lower FP32 performance
    This graphics card has a lower FP32 performance than the average graphics card (10.8 TFLOPS vs 22.6 TFLOPS). The average graphics card has FP32 performance of 22.6 TFLOPS.
    10.79 TFLOPS vs 22.6 TFLOPS
  • 10.8% lower texture rate
    This graphics card has a lower texture rate than the average graphics card (337.3 GTexel/s vs 378 GTexel/s). The average graphics card has a texture rate of 378 GTexel/s.
    337.3 GTexel/s vs 378 GTexel/s
  • 32.3% lower gaming score
    This graphics card has a lower gaming score than the average graphics card (10,000 points vs 14,779 points). The average graphics card has a gaming score of 14,779 points.
    10,000 points vs 14,779 points
  • 24.3% lower PassMark score
    This graphics card has a lower PassMark score than the average graphics card (17,145 points vs 22,638 points). The average graphics card has a PassMark score of 22,638 points.
    17,145 points vs 22,638 points
  • 39.4% lower ray tracing score
    This graphics card has a lower ray tracing score than the average graphics card (5,543 points vs 9,148 points). The average graphics card has a ray tracing score of 9,148 points.
    5,543 points vs 9,148 points
  • 1 years older
    This graphics card was released earlier than the average graphics card (2022 vs 2023).
    May 2022
    2,022 vs 2,023
  • 37.9% lower compute score
    This graphics card has a lower compute score than the average graphics card (7,495 points vs 12,70.5 points). The average graphics card has a compute score of 12,070.5 points.
    7,495 points vs 12,070.5 points
  • 2,304 fewer FP32 units
    This graphics card has fewer FP32 units than the average graphics card (2048 vs 4,352). The average graphics card has 4,352 FP32 units.
    2,048 vs 4,352
  • 4 GB less VRAM
    This graphics card has fewer VRAM than the average graphics card (8 GB vs 12 GB). The average graphics card has 12 GB VRAM.
    8 GB vs 12 GB
  • 64 bit narrower memory bus
    This graphics card has a narrower memory bus than the average graphics card (128 bit vs 192 bit). The average graphics card has a memory bus width of 192 bit.
    128 bit vs 192 bit
  • 37.5% lower memory bandwidth
    This graphics card has a lower memory bandwidth than the average graphics card (280 GB/s vs 448 GB/s). The average graphics card has a memory bandwidth of 448 GB/s.
    280 GB/s vs 448 GB/s
  • 91.7% smaller L2 cache
    This graphics card has fewer L2 cache than the average graphics card (2 MB vs 24 MB). The average graphics card has 24 MB L2 cache.
    2 MB vs 24 MB
  • 7.9% slower memory speed
    This graphics card has a lower effective memory speed than the average graphics card (17,500 MHz vs 19,000 MHz). The average graphics card reaches an effective memory speed of 19,000 MHz.
    17,500 MHz vs 19,000 MHz
  • No DLSS support
    This graphics card does not support DLSS, the average graphics card does.
  • Fewer PCIe lanes
    This graphics card has fewer PCIe lanes than the average graphics card (x8 vs x16). The average graphics card has x16 PCIe lanes.
    x8 vs x16
  • Less advanced frame generation
    This graphics card has less advanced frame generation than the average graphics card (frame generation vs multi frame generation).
    frame generation vs multi frame generation
  • 40% larger process node
    This graphics card uses a larger manufacturing process than the average graphics card (7 nm vs 5 nm). The average graphics card uses a manufacturing process of 5 nm.
    7 nm vs 5 nm
  • Older Vulkan version
    This graphics card supports an older Vulkan version than the average graphics card (1.3 vs 1.4).
    1.3 vs 1.4
  • Older DirectX version
    This graphics card supports an older DirectX version than the average graphics card (12 vs 12 Ultimate).
    12 vs 12 Ultimate
  • Older shader model
    This graphics card supports an older shader model than the average graphics card (6.7 vs 6.8).
    6.7 vs 6.8
  • 51.5% fewer transistors
    This graphics card has fewer transistors than the average graphics card (11,100 million vs 22,900 million). The average graphics card has 22,900 million transistors.
    11,100 million vs 22,900 million
  • No AV1 encoding
    This graphics card does not support AV1 encoding, the average graphics card does.
  • Older HDMI version
    This graphics card supports an older HDMI version than the average graphics card (2.1 vs 2.1a).
    2.1 vs 2.1a
  • 62.5% lower DisplayPort bandwidth
    This graphics card has a lower DisplayPort bandwidth than the average graphics card (8.1 Gbps vs 21.6 Gbps). The average graphics card has DisplayPort bandwidth of 21.6 Gbps.
    8.1 Gbps vs 21.6 Gbps
  • 1 fewer fans
    This graphics card has fewer fans than the average graphics card (2 vs 3).
    2 vs 3
  • 15 °C lower thermal ceiling
    This graphics card has a lower thermal ceiling than the average graphics card (110 °C vs 95 °C). The average graphics card has a thermal ceiling of 95 °C.
    110 °C vs 95 °C

Video Reviews

Hands-on testing, unboxing, and real-world video evaluations

9.0
CRATER BENCHMARKS
≈ estimated
06/01/2025
Benchmark test · 25 games at 1080p
Verdict
AMD Radeon RX 6650 XT delivers solid 1080p frame rates in most of 25 games and is a good pick for a value PC build.
8.0
Limitless-Hardware
≈ estimated
09/08/2023
Hands-on review · game tests, cooler and card build
Verdict
AMD Radeon RX 6650 XT is the best value for 1080p at its price point, though ray tracing and some demanding games need lower settings.
5.0
ConsoleLoop
≈ estimated
22/07/2023
Unboxing · long-term use · 1080p and ray tracing notes
Verdict
AMD Radeon RX 6650 XT is good at 1080p, but barely faster than an RX 5700 XT and not worth buying new.
8.0
Jordan Ash
≈ estimated
04/02/2023
Hands-on review · benchmarks, temperatures and price comparison
Verdict
AMD Radeon RX 6650 XT is a solid 1080p budget card, best run at high settings rather than 1440p.
9.0
Level1Techs
≈ estimated
10/05/2022
Hands-on review · launch impressions and value overview
Verdict
AMD Radeon RX 6650 XT is a 6600 with a bit more performance, a strong choice for most games if it is available near list price.
6.0
Hardware Unboxed
≈ estimated
10/05/2022
Benchmark review · power, thermals and RTX 3060 comparison
Verdict
AMD Radeon RX 6650 XT is a minor refresh, barely faster than the 6600 XT, but still the better pick over the RTX 3060 at this price.
5.0
eTeknix
≈ estimated
10/05/2022
Hands-on review · benchmarks and Nitro+ card features
Verdict
AMD Radeon RX 6650 XT is only slightly faster than the 6600 XT for a higher price, and not enough to beat Nvidia's 3060 Ti.
8.0
Matt Miller
≈ estimated
25/03/2024
Benchmark review · game FPS tests at 1080p and 1440p
Verdict
AMD Radeon RX 6650 XT offers strong frame rates for the price, and frame generation adds a lot, though Cyberpunk at Ultra is demanding.
Not graded
Not graded
Overview video
Not graded

Expert Reviews

In-depth analysis and verdict from leading tech publications

6.0
tomshardware.com
✓ explicit
11/6/2022
Benchmark review · White Hellhound model
Verdict
The PowerColor Hellhound Spectral White is a minor upgrade over the RX 6600 XT, with a rare white design and faster memory but little performance gain.
7.0
techspot.com
✓ explicit
1/5/2023
Benchmark review · RX 6600 XT refresh
Verdict
The AMD Radeon RX 6650 XT is an overclocked RX 6600 XT, about 6% faster at 1080p and 12% ahead of the RTX 3060 at 1440p.
6.0
techradar.com
✓ explicit
1/7/2022
Hands-on review · ASUS ROG Strix model
Verdict
The AMD Radeon RX 6650 XT is a decent refresh of the RX 6600 XT, only modestly faster, and worth buying only if RTX 3060 cards are out of reach.
8.0
club386.com
≈ estimated
9/6/2022
Lab test · Quiet cooler
Verdict
The Sapphire Radeon RX 6650 XT Nitro+ is very quiet and cool for 1080p and 1440p gaming, but only a small step up from the RX 6600 XT.
7.0
rockpapershotgun.com
≈ estimated
3/9/2024
Hands-on test · 1080p and 1440p
Verdict
The Sapphire Radeon RX 6650 XT Nitro+ is a good 1080p card and decent 1440p choice, but newer cards are on the way, so waiting may be wiser.
5.2
computerbild.de
✓ explicit
10/5/2022
Lab test · Full HD gaming
Verdict
The PowerColor Red Devil RX 6650 XT handles Full HD gaming well and manages WQHD with reduced effects, but it is loud under load and weak with ray tracing.
8.0
pcmasters.de
≈ estimated
5/4/2028
Benchmark test · Red Devil model
Verdict
The PowerColor Red Devil RX 6650 XT is a well-built card with a dual BIOS switch, but it is still well behind an RTX 3060 Ti in ray tracing.
8.0
notebookcheck.com
≈ estimated
8/9/2023
Lab test · Full HD gaming
Verdict
The Sapphire Nitro+ Radeon RX 6650 XT is a strong Full HD card that stays smooth in most games and reaches 1440p in lighter titles.
8.5
connect-living.de
✓ explicit
12/11/2023
Lab test · Full HD card
Verdict
The Sapphire Nitro+ Radeon RX 6650 XT is a very good Full HD card that can handle WQHD, with smooth frame rates in most games.
8.0
notebookcheck.biz
≈ estimated
11/9/2023
Benchmark test · 1080p card
Verdict
The Sapphire Nitro+ RX 6650 XT is a strong 1080p card with a good cooler, though it stays well behind Nvidia's RTX 3080 in ComputeMark tests.
9.0
elchapuzasinformatico.com
≈ estimated
5/10/2022
Hands-on review · Compact Full HD card
Verdict
The PowerColor Hellhound RX 6650 XT is a compact, quiet card that handles Full HD at ultra settings, but ray tracing and DLSS trail Nvidia.
9.0
as.com
≈ estimated
9/30/2022
Hands-on test · Quiet 1440p card
Verdict
The Sapphire Nitro+ RX 6650 XT is a quiet, compact card that holds 60 fps at 1440p in most games, though Metro Exodus Enhanced struggles.
6.0
hwupgrade.it
≈ estimated
10/5/2022
Hands-on test · ASUS and Sapphire models
Verdict
The AMD Radeon RX 6650 XT is a small step up from the RX 6600 XT, with the ASUS ROG Strix running cooler and the Sapphire Nitro+ quieter.
8.0
smartworld.it
≈ estimated
5/9/2023
Hands-on review · Full HD gaming
Verdict
The Sapphire Nitro+ RX 6650 XT is strong at Full HD and runs quietly, but it is weak at ray tracing and takes 2.5 slots.
7.9
thegamesmachine.it
✓ explicit
11/9/2023
Hands-on test · Quiet cooling
Verdict
The Sapphire Radeon RX 6650 XT Nitro+ is a quiet, well-cooled card for Full HD and WQHD gaming, but its PCIe x8 link can slow it on older Intel boards.

Third-Party Reviews

What Customers Like About AMD Radeon RX 6650 XT

  • Excellent price-to-performance ratio for 1080p gaming
  • Highly efficient power consumption compared to competitors
  • Strong rasterization performance, often beating the RTX 3060
  • Runs quietly and maintains impressive thermal levels
  • Great for high-refresh-rate esports titles
  • Solid entry-level or budget build choice

What Customers Don't Like About AMD Radeon RX 6650 XT

  • Poor ray tracing performance compared to Nvidia alternatives
  • Limited 8GB VRAM may bottleneck future AAA titles
  • Marginal performance gains over the original RX 6600 XT
  • Narrow 128-bit memory bus can limit high-resolution (1440p+) stability
  • Occasional reports of driver-related black screens or stuttering
  • Performance drops significantly when used on older PCIe 3.0 systems

Verdict

The AMD Radeon RX 6650 XT is a mid-range graphics card based on the RDNA 2 architecture, featuring 2,048 stream processors, 32 Ray Accelerators, and 32MB of Infinity Cache. It operates at a base clock of 2,055 MHz with a boost speed reaching 2,635 MHz, and it is equipped with 8GB of GDDR6 memory on a 128-bit bus with an effective speed of 17.5 Gbps. Its main strengths include exceptional performance for 1080p gaming, competitive power efficiency with a 176W–180W TBP, and better value-for-money compared to its Nvidia counterparts in high-refresh-rate scenarios. However, it faces notable limitations such as a narrow 128-bit memory bus that restricts performance at 1440p and higher resolutions, mediocre hardware-accelerated ray tracing compared to Nvidia's RTX series, and a PCIe 4.0 x8 interface that may cause performance drops on older PCIe 3.0 systems.

Compare AMD Radeon RX 6650 XT With Other Products in the Graphics Cards Category

1Product to compare no. 1
VS
2Product to compare no. 2
VS
3Product to compare no. 3 (optional)

Graphic Comparison of AMD Radeon RX 6650 XT and Other Products in the Graphics Cards Category

No results found