Scored using Graphics cards Methodology v3.0
Graphics cards Methodology v3.0
Mathematical & Unbiased Scoring
Products in this category are scored under Frontum Graphics cards Methodology v3.0: the technical score from the specifications is the base, and independent expert and video reviews (up to ±0.5 points), owner opinions (up to ±0.3) and best-of lists (up to +0.3) move it up or down.
Explore Graphics cards Methodology v3.0

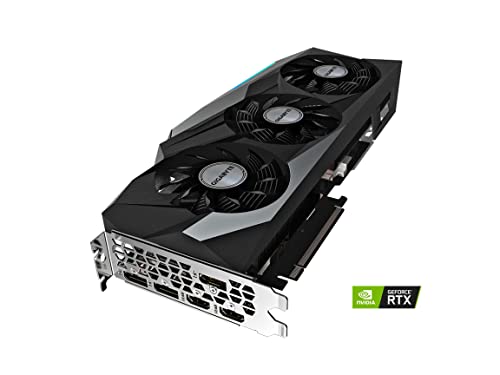
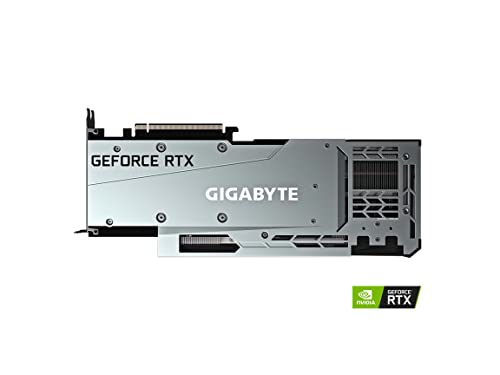
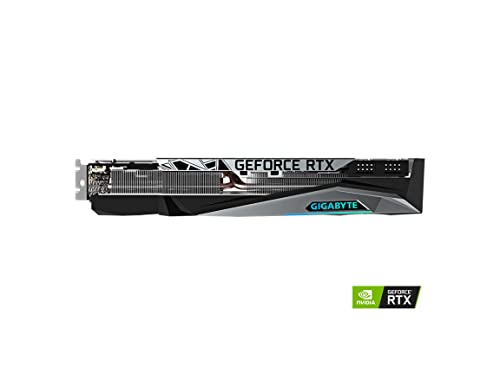
GIGABYTE GeForce RTX 3080 Gaming OC 12G Review: 117 Specs Compared

Avg. price:~$800VRAM:12 GBMemory bus width:384 bitThermal Design Power (TDP):350 W

GIGABYTE GeForce RTX 3080 Gaming OC 12G Review: Compare 117 technical specifications and 238 owner opinions to see how this product ranks in the Graphics cards category and whether it is worth buying.
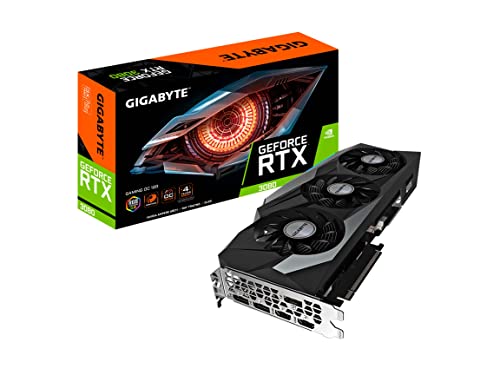
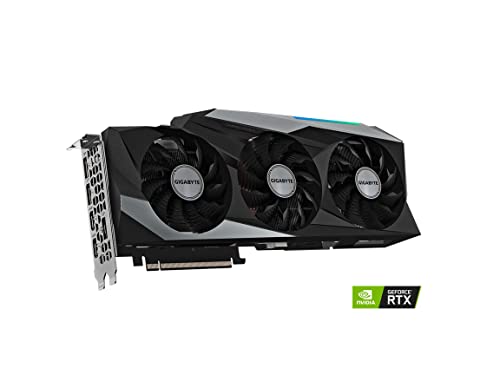
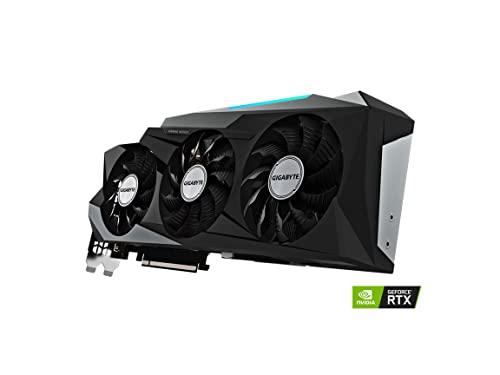
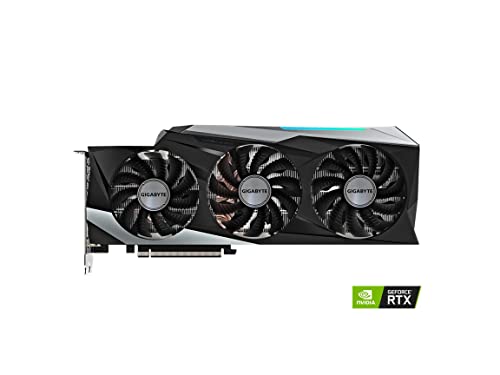
GIGABYTE GeForce RTX 3080 Gaming OC 12G
7.6/10

Overall score

Score
7.6/ 10
✕
What it is
Our main score for this model, 1–10. It combines specs, expert reviews, best-of lists and owners.
How we count it
Parts: Technical score 40%, Reviews score 25%, List score 25%, Sentiment score 10%
Marks: Each part gets a mark out of 10. For reviews, lists and owners, a typical model in this category gets about 8 and the best one gets 10.
No data yet: A part with no data shows "?". It counts as the mark of a weaker model in this category (4 in 5 models with data score higher). This way, models with reviews, lists and owners usually come out ahead.
Score distribution
▼
<55-66-77-88-99-10
Score components

40%

7.7

Technical Score

25%

?

Reviews scoreNot enough data yet, so we use 7.6, the mark of a weaker model in this category

25%

?

List scoreNot enough data yet, so we use 7.5, the mark of a weaker model in this category

10%

7.7

Sentiment score

▲Better than 59% of graphics cards
7.2

Ratio quality/price

Ratio quality/price
7.2/ 10
✕
What it is
An indicator that combines the graphics card's overall rating with its cost.
When it matters
When you are looking for a graphics card that offers a strong balance of performance, features, and price.
Score distribution
▼
<55-66-77-88-99-10
Score components

70%

7.6

Overall score

30%

6.3

Price

▼Worse than 61%
7.7

Technical Score

Technical score
7.7/ 10
✕
What it is
How good the specs are compared with the other models in this category, 1–10.
How we count it
Areas: We rate the specs in each area against the other models in this category.
Weighting: The areas that matter most to buyers count more. The shares are shown under Score components.
Share: The technical score is 40% of the overall score.
Score distribution
▼
<55-66-77-88-99-10
Score components

44%

7.2

Performance

24%

7.7

Memory

12%

7.9

Power

11%

9.2

Features

5%

6.7

Design

4%

9.1

Connectivity

▲Better than 63%
?

Reviews score

Reviews score
✕
What it is
Average grade from independent test sites, magazines and video reviewers, 1–10.
How we count it
Grades: Each review's own score is converted to 1–10; without one, we grade the review ourselves. Big test sites count more, short reviews half as much as full tests. A video review counts half.
Score: The average grade is 80% of the review mark; the number of reviews is the other 20% (1 review = 5, the typical number in this category = 8, the most-reviewed model = 10).
Enough data: With few reviews, the average grade is pulled toward the typical grade of this category. No reviews yet: 7.6 for now.
Share: Reviews count 25% of the overall score.
Score distribution
▼
<55-66-77-88-99-10
Grades by review (0)
We have not found an independent test of this model yet. Until we do, its review part counts as 7.6.
User ratings collected online are not part of this score.
No expert tests yet
7.7

Sentiment score

Sentiment score
7.7/ 10
✕
What it is
How positive owners are about this model in their comments under video reviews and on forums. We read each comment, keep only people who say they own the model, and sort them into positive, mixed or negative.
How we count it
Score: We compare how satisfied this model’s owners are with the other models in this category: the typical model gets 8, the most satisfied tenth 10, the least satisfied 4. This is 80% of the owner mark; the number of owners is the other 20%.
Enough data: A model counts with 10+ owners from 4+ different discussions. With fewer, the owner part counts as 7.8 for now.
Share: Owners count 10% of the overall score (left out in categories where fewer than 10 models have enough owner comments).
Score distribution
▼
<55-66-77-88-99-10

7.7

Mark 8.1 is below the typical mark 8.2 of this category, so it cannot lift the score above the technical score

80%

7.7

Satisfaction

20%

10

Popularity

Owners (238)
238 owners from 24 online discussions
68% positive
12% mixed
19% negative
Category average: 73% positive
Our own analysis of online owner opinions, not a rating from any website.
▼Worse than 64%
?

List score

List score
7.5/ 10
✕
What it is
How often independent test sites, magazines and video reviewers put this model in their best-of lists for this category.
How we count it
Points: The model in the most lists of this category gets 10; the others get 8 to 10 in proportion. In no list yet: 7.5. Lists count 25% of the overall score.
Enough data: Every list counts, even a single one. With fewer than 5 best-of lists in the category, this part is left out.
Lists with this model (0)
Not in any best-of list yet, so this part counts as 7.5. Models in a list get 8 to 10.
Not in any best-of list yet

What owners say about the GIGABYTE GeForce RTX 3080 Gaming OC 12G

Based on 238 owners sharing their experience in online comments

68%positive13%mixed19%negative

Owners praise strong, lasting gaming performance, while limited VRAM, high power use, and heat cause the most frustration.

What owners dislike

  • Several owners say the card runs very hot and heats up small rooms, with some models hitting over 100 C in the VRM or hotspot without new pads or paste.7
  • Owners say 10GB of VRAM runs out in newer games at 1440p and 4K, causing stutters or forcing lower texture settings.4

Points mentioned by at least 3 owners, most mentioned first.

Loading...
Loading category ranking...

Technical Specifications of Graphics Card GIGABYTE GeForce RTX 3080 Gaming OC 12G

Technical Score
Technical score
7.7/ 10
✕
What it is
How good the specs are compared with the other models in this category, 1–10.
How we count it
Areas: We rate the specs in each area against the other models in this category.
Weighting: The areas that matter most to buyers count more. The shares are shown under Score components.
Share: The technical score is 40% of the overall score.
Score distribution
▼
<55-66-77-88-99-10
Score components:

44%

7.2

Performance

24%

7.7

Memory

12%

7.9

Power

11%

9.2

Features

5%

6.7

Design

4%

9.1

Connectivity

7.7
Reviews score
7.6
Sentiment score
7.7
List score
?
Ratio quality/price
Value for money
7.2/ 10
✕
What it is
An indicator that combines the graphics card's overall rating with its cost.
When it matters
When you are looking for a graphics card that offers a strong balance of performance, features, and price.
Score distribution
▼
<55-66-77-88-99-10
Score components:

70%

7.6

Overall score

30%

6.3

Price

7.2
3DMark Time Spy benchmark score
18,656 points
This graphics card scores 18,656 points in 3DMark Time Spy, which is higher than 62.3% of graphics cards.
3DMark Port Royal score
12,653 points
This graphics card scores 12,653 points in 3DMark Port Royal, which is higher than 63.1% of graphics cards.
PassMark (G3D) result
23,907 points
This graphics card scores 23,907 points in PassMark G3D, which is higher than 55.1% of graphics cards and equal to 0.4% of graphics cards.
PassMark (DirectCompute) result
15,070 points
This graphics card scores 15,070 points in PassMark DirectCompute, which is higher than 61.3% of graphics cards and equal to 0.6% of graphics cards.
FP32 performance
31.45 TFLOPS
This graphics card delivers 31.45 TFLOPS FP32 performance, which is higher than that of 64.3% of graphics cards.
Show more
VRAM
12 GB
This graphics card has 12 GB of VRAM, which is more than 46% of graphics cards and equal to 16% of graphics cards.
Memory type
GDDR6X
This graphics card uses GDDR6X memory, which is newer than on 57.1% of graphics cards and equal to 22.4% of graphics cards.
Memory bus width
384 bit
This graphics card uses a 384 bit memory bus, which is wider than that of 89.7% of graphics cards and equal to that of 7% of graphics cards.
Maximum memory bandwidth
912 GB/s
This graphics card reaches 912 GB/s memory bandwidth, which is higher than that of 86.7% of graphics cards and equal to that of 0.6% of graphics cards.
Effective memory speed
19,000 MHz
This graphics card reaches an effective memory speed of 19,000 MHz, which is faster than that of 48.5% of graphics cards and equal to that of 3.2% of graphics cards.
Show more
PCI Express (PCIe) version
4
This graphics card supports PCIe 4, which is newer than on 22.5% of graphics cards and equal to 50.5% of graphics cards.
PCIe lanes
x16
This graphics card uses x16 PCIe lanes, which is more than 24.1% of graphics cards and equal to 75.9% of graphics cards.
DirectX version
12 Ultimate
This graphics card supports DirectX 12 Ultimate, which is more advanced than on 22.8% of graphics cards and equal to 77.2% of graphics cards.
Vulkan version
1.3
This graphics card supports Vulkan 1.3, which is older than on 79.2% of graphics cards and equal to 15.6% of graphics cards.
OpenGL version
4.6
This graphics card supports OpenGL 4.6, which is more advanced than on 2% of graphics cards and equal to 98% of graphics cards.
Show more
Max displays supported
4
This graphics card supports up to 4 displays, which is more than 9% of graphics cards and equal to 88.2% of graphics cards.
Max digital resolution
7680x4320
This graphics card supports a maximum digital resolution of 7680x4320, which is higher than that of 9.2% of graphics cards and equal to that of 90.9% of graphics cards.
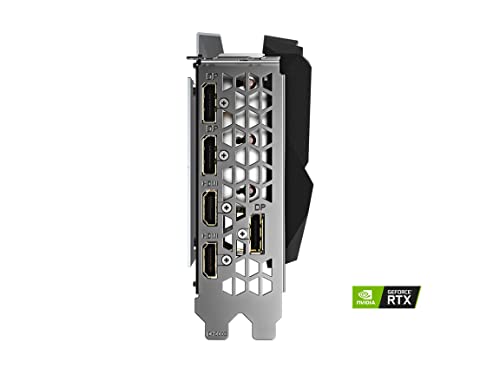
DisplayPort outputs
3
This graphics card offers 3 DisplayPort outputs, which is more than 21.7% of graphics cards and equal to 76% of graphics cards.
DisplayPort version
1.4a
This graphics card supports DisplayPort 1.4a, which is more advanced than on 19.3% of graphics cards and equal to 46.3% of graphics cards.
DisplayPort link rates
8.1 Gbps
This graphics card supports DisplayPort link rates up to 8.1 Gbps, which is slower than on 65.3% of graphics cards and equal to 22.5% of graphics cards.
Show more
Thermal Design Power (TDP)
350 W
This graphics card has a TDP of 350 W, which is higher than that of 86.3% of graphics cards and equal to that of 1.6% of graphics cards.
Power consumption while under peak load
370 W
This graphics card draws 370 W under peak load, which is higher than 90.4% of graphics cards and equal to 0.4% of graphics cards.
Recommended PSU wattage
750 W
This graphics card recommends a 750 W PSU, which is higher than that of 65.4% of graphics cards and equal to that of 16.8% of graphics cards.
Board power limit
370 W
This graphics card has a board power limit of 370 W, which is higher than that of 88.1% of graphics cards and equal to that of 0.4% of graphics cards.
PCIe power spec
350 W
Show more
Size
320x 129x 55 mm
Length
320 mm
This graphics card is 320 mm long, which is longer than 73.9% of graphics cards and equal in length to 1.4% of graphics cards.
Height
129 mm
This graphics card is 129 mm tall, which is taller than 58.1% of graphics cards and equal in height to 0.9% of graphics cards.
Slot width
2.7 slot/s
This graphics card occupies 2.7 slot/s, which is wider than 65.9% of graphics cards and equal in width to 2.2% of graphics cards.
Weight
2.99 lb
This graphics card weighs 2.99 lb, which is heavier than 67.8% of Graphics cards and equal to 0.1% of Graphics cards.
Show more

GIGABYTE GeForce RTX 3080 Gaming OC 12G vs the Average Graphics Card

246810TotalPerformanceMemoryFeaturesConnectivityPowerDesign
  • 192 bit wider memory bus
    This graphics card has a wider memory bus than the average graphics card (384 bit vs 192 bit). The average graphics card has a memory bus width of 192 bit.
    384 bit vs 192 bit
  • 2.04x higher memory bandwidth
    This graphics card has a higher memory bandwidth than the average graphics card (912 GB/s vs 448 GB/s). The average graphics card has a memory bandwidth of 448 GB/s.
    912 GB/s vs 448 GB/s
  • 30 more compute units
    This graphics card has more compute units than the average graphics card (70 vs 40). The average graphics card has 40 compute units.
    70 vs 40
  • 30 more ray tracing cores
    This graphics card has more ray tracing cores than the average graphics card (70 vs 40). The average graphics card has 40 ray tracing cores.
    70 vs 40
  • 96 more TMUs
    This graphics card has more TMUs than the average graphics card (280 vs 184). The average graphics card has 184 TMUs.
    280 vs 184
  • 32 more ROPs
    This graphics card has more ROPs than the average graphics card (96 vs 64). The average graphics card has 64 ROPs.
    96 vs 64
  • 128 more AI cores
    This graphics card has more AI cores than the average graphics card (272 vs 144). The average graphics card has 144 AI cores.
    272 vs 144
  • 30% higher texture rate
    This graphics card has a higher texture rate than the average graphics card (491.4 GTexel/s vs 378 GTexel/s). The average graphics card has a texture rate of 378 GTexel/s.
    491.4 GTexel/s vs 378 GTexel/s
  • 30 more compute units
    This graphics card has more compute units than the average graphics card (70 vs 40). The average graphics card has 40 compute units.
    70 vs 40
  • 30 more ray tracing cores
    This graphics card has more ray tracing cores than the average graphics card (70 vs 40). The average graphics card has 40 ray tracing cores.
    70 vs 40
  • 96 more TMUs
    This graphics card has more TMUs than the average graphics card (280 vs 184). The average graphics card has 184 TMUs.
    280 vs 184
  • 32 more ROPs
    This graphics card has more ROPs than the average graphics card (96 vs 64). The average graphics card has 64 ROPs.
    96 vs 64
  • 128 more AI cores
    This graphics card has more AI cores than the average graphics card (272 vs 144). The average graphics card has 144 AI cores.
    272 vs 144
  • 30% higher texture rate
    This graphics card has a higher texture rate than the average graphics card (491.4 GTexel/s vs 378 GTexel/s). The average graphics card has a texture rate of 378 GTexel/s.
    491.4 GTexel/s vs 378 GTexel/s
  • 39.2% higher FP32 performance
    This graphics card has a higher FP32 performance than the average graphics card (31.5 TFLOPS vs 22.6 TFLOPS). The average graphics card has FP32 performance of 22.6 TFLOPS.
    31.45 TFLOPS vs 22.6 TFLOPS
  • 21.9% higher pixel rate
    This graphics card has a higher pixel rate than the average graphics card (196.6 GPixel/s vs 161.3 GPixel/s). The average graphics card has a pixel rate of 161.3 GPixel/s.
    196.6 GPixel/s vs 161.3 GPixel/s
  • 192 bit wider memory bus
    This graphics card has a wider memory bus than the average graphics card (384 bit vs 192 bit). The average graphics card has a memory bus width of 192 bit.
    384 bit vs 192 bit
  • 2.04x higher memory bandwidth
    This graphics card has a higher memory bandwidth than the average graphics card (912 GB/s vs 448 GB/s). The average graphics card has a memory bandwidth of 448 GB/s.
    912 GB/s vs 448 GB/s
  • Supports LHR limiting
    This graphics card supports an LHR limiter, while the average graphics card does not. 7.5% of Graphics cards support one.
  • More NVENC sessions
    This graphics card has more concurrent NVENC sessions than the average graphics card (12 vs 8). The average graphics card has 8 concurrent NVENC sessions.
    12 vs 8
  • 29.9% lower boost clock speed
    This graphics card has a lower boost GPU clock than the average graphics card (1,755 MHz vs 2,505 MHz). The average graphics card has a boost GPU clock of 2,505 MHz.
    1,755 MHz vs 2,505 MHz
  • Less advanced frame generation
    This graphics card has less advanced frame generation than the average graphics card (no vs multi frame generation).
  • 34.4% lower base clock speed
    This graphics card has a lower base GPU clock than the average graphics card (1,260 MHz vs 1920 MHz). The average graphics card has a base GPU clock of 1920 MHz.
    1,260 MHz vs 1,920 MHz
  • 60% larger process node
    This graphics card uses a larger manufacturing process than the average graphics card (8 nm vs 5 nm). The average graphics card uses a manufacturing process of 5 nm.
    8 nm vs 5 nm
  • 62.8% higher TDP
    This graphics card has a higher TDP than the average graphics card (350 W vs 215 W). The average graphics card has a TDP of 215 W.
    350 W vs 215 W
  • No AV1 encoding
    This graphics card does not support AV1 encoding, the average graphics card does.
  • 32.1% slower VRAM clock
    This graphics card has a lower VRAM clock than the average graphics card (1,188 MHz vs 1,750 MHz). The average graphics card runs its VRAM at 1,750 MHz.
    1,188 MHz vs 1,750 MHz
  • 68.2% higher board power limit
    This graphics card has a higher board power limit than the average graphics card (370 W vs 220 W). The average graphics card has a board power limit of 220 W.
    370 W vs 220 W
  • 60% more expensive
    GIGABYTE GeForce RTX 3080 Gaming OC 12G is more expensive than the average graphics card ($800 vs $500).
    $800 vs $500
  • 29.9% lower boost clock speed
    This graphics card has a lower boost GPU clock than the average graphics card (1,755 MHz vs 2,505 MHz). The average graphics card has a boost GPU clock of 2,505 MHz.
    1,755 MHz vs 2,505 MHz
  • 34.4% lower base clock speed
    This graphics card has a lower base GPU clock than the average graphics card (1,260 MHz vs 1920 MHz). The average graphics card has a base GPU clock of 1920 MHz.
    1,260 MHz vs 1,920 MHz
  • 1 years older
    This graphics card was released earlier than the average graphics card (2022 vs 2023).
    January 2022
    2,022 vs 2,023
  • 32.1% slower VRAM clock
    This graphics card has a lower VRAM clock than the average graphics card (1,188 MHz vs 1,750 MHz). The average graphics card runs its VRAM at 1,750 MHz.
    1,188 MHz vs 1,750 MHz
  • 75% smaller L2 cache
    This graphics card has fewer L2 cache than the average graphics card (6 MB vs 24 MB). The average graphics card has 24 MB L2 cache.
    6 MB vs 24 MB
  • Less advanced frame generation
    This graphics card has less advanced frame generation than the average graphics card (no vs multi frame generation).
  • 60% larger process node
    This graphics card uses a larger manufacturing process than the average graphics card (8 nm vs 5 nm). The average graphics card uses a manufacturing process of 5 nm.
    8 nm vs 5 nm
  • Older Vulkan version
    This graphics card supports an older Vulkan version than the average graphics card (1.3 vs 1.4).
    1.3 vs 1.4
  • 2.14x larger GPU die
    This graphics card has a higher GPU die size than the average graphics card (628 mm² vs 294 mm²). The average graphics card has a GPU die size of 294 mm².
    628 mm² vs 294 mm²
  • Older FSR version
    This graphics card supports an older FSR version than the average graphics card (3 vs 3.1).
    3.0 vs 3.1
  • No AV1 encoding
    This graphics card does not support AV1 encoding, the average graphics card does.
  • Older HDMI version
    This graphics card supports an older HDMI version than the average graphics card (2.1 vs 2.1a).
    2.1 vs 2.1a
  • More basic codec support
    This graphics card encodes more basic formats than the average graphics card (H.264/H.265 vs H.264/H.265/AV1/VP9).
    H.264/H.265 vs H.264/H.265/AV1/VP9
  • No 3D output
    This graphics card does not support 3D output, the average graphics card does.
  • Older NVDEC generation
    This graphics card has a lower NVDEC generation than the average graphics card (5 vs 6). The average graphics card offers NVDEC generation 6.
    5 vs 6
  • 62.5% lower DisplayPort bandwidth
    This graphics card has a lower DisplayPort bandwidth than the average graphics card (8.1 Gbps vs 21.6 Gbps). The average graphics card has DisplayPort bandwidth of 21.6 Gbps.
    8.1 Gbps vs 21.6 Gbps
  • 62.8% higher TDP
    This graphics card has a higher TDP than the average graphics card (350 W vs 215 W). The average graphics card has a TDP of 215 W.
    350 W vs 215 W
  • 68.2% higher board power limit
    This graphics card has a higher board power limit than the average graphics card (370 W vs 220 W). The average graphics card has a board power limit of 220 W.
    370 W vs 220 W
  • 15.4% higher PSU requirement
    This graphics card has a higher PSU requirement than the average graphics card (750 W vs 650 W). The average graphics card has a PSU requirement of 650 W.
    750 W vs 650 W
  • 68.2% higher peak power draw
    This graphics card has a higher peak power draw than the average graphics card (370 W vs 220 W). The average graphics card has a peak power draw of 220 W.
    370 W vs 220 W
  • 11 °C higher idle temperature
    This graphics card has a higher idle temperature than the average graphics card (48 °C vs 37 °C). The average graphics card has an idle temperature of 37 °C.
    48 °C vs 37 °C
  • 7 °C higher load temperature
    This graphics card has a higher load temperature than the average graphics card (74 °C vs 67 °C). The average graphics card has a load temperature of 67 °C.
    74 °C vs 67 °C
  • 37.8 mm longer card length
    This graphics card is longer than the average graphics card (320 mm vs 282.2 mm). The average graphics card has a length of 282.2 mm.
    320 mm vs 282.2 mm
  • 4 mm higher card profile
    This graphics card is taller than the average graphics card (129 mm vs 125 mm). The average graphics card has a height of 125 mm.
    129 mm vs 125 mm
  • 0.2 slot/s wider design
    This graphics card occupies more slots than the average graphics card (2.7 slot/s vs 2.5 slot/s). The average graphics card occupies 2.5 slot/s.
    2.7 slot/s vs 2.5 slot/s

Third-Party Reviews

What Customers Like About GIGABYTE GeForce RTX 3080 Gaming OC 12G

  • Exceptional 1440p and 4K gaming performance, often rivaling more expensive cards like the 3080 Ti.
  • Highly efficient Windforce 3X cooling system that maintains low operating temperatures (typically mid-60s°C) even under load.
  • The 12GB of VRAM and 384-bit bus provide better longevity and higher memory bandwidth than the original 10GB model.
  • Extended 4-year manufacturer warranty (with registration) offers significant peace of mind over competitors.
  • Solid build quality featuring a protective metal backplate and dual BIOS options for silent operation.
  • Quiet fan operation during non-intensive tasks thanks to the semi-passive 3D Active Fan design.

What Customers Don't Like About GIGABYTE GeForce RTX 3080 Gaming OC 12G

  • Massive physical dimensions (over 320mm long and 3-slot thick) make it difficult to fit in smaller or even some mid-tower cases.
  • High initial MSRP and historical price markups compared to the base 10GB variant.
  • Gigabyte's RGB Fusion software is frequently criticized by users for being buggy or difficult to use.
  • Significant power requirements, necessitating a high-quality power supply to avoid system crashes.
  • Minimal RGB lighting features compared to other premium custom cards like the Aorus series.
  • Some users reported minor 'coil whine' during high-intensity gaming sessions.

Verdict

The Gigabyte GeForce RTX 3080 Gaming OC 12G is a high-end graphics card featuring 8,960 CUDA cores and a factory-overclocked boost clock of 1755 MHz. It is equipped with 12GB of GDDR6X VRAM on a wide 384-bit memory interface, delivering approximately 912 GB/s of bandwidth to handle demanding 4K gaming. Its main characteristics include the WINDFORCE 3X cooling system with three alternate-spinning fans, a protective metal backplate, and dual BIOS for switching between OC and silent modes. Key pros include exceptional thermal management that keeps GPU temperatures in the mid-60°C range, a generous 4-year warranty, and performance that nearly matches the RTX 3080 Ti. However, its significant 320mm length may cause fitment issues in smaller cases, and it exhibits some PCB flex due to the cooler's substantial weight.

Compare GIGABYTE GeForce RTX 3080 Gaming OC 12G With Other Products in the Graphics Cards Category

1Product to compare no. 1
VS
2Product to compare no. 2
VS
3Product to compare no. 3 (optional)

Graphic Comparison of GIGABYTE GeForce RTX 3080 Gaming OC 12G and Other Products in the Graphics Cards Category

No results found