Scored using Processors Methodology v3.0
Processors Methodology v3.0
Mathematical & Unbiased Scoring
Products in this category are scored under Frontum Processors Methodology v3.0: the technical score from the specifications is the base, and independent expert and video reviews (up to ±0.5 points), owner opinions (up to ±0.3) and best-of lists (up to +0.3) move it up or down.
Explore Processors Methodology v3.0

Intel Core i9-7900X Review: 74 Specs Compared

Avg. price:~$360PassMark multi-core score:20883N. of physical cores:10CPU boost clock speed:4.5 GHzCPU socket:LGA2066TDP (Thermal design power):140 W

Intel Core i9-7900X Review: Compare 74 technical specifications, 36 expert and video reviews and 27 owner opinions to see how this product ranks in the Processors category and whether it is worth buying.
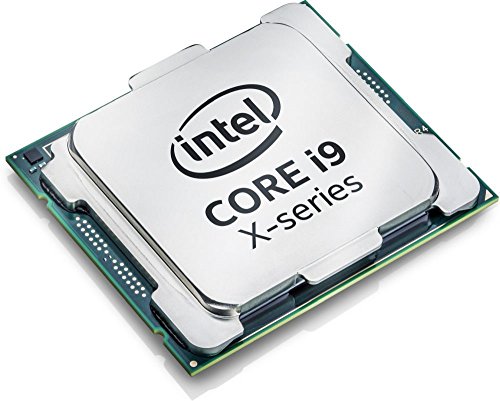
Intel Core i9-7900X
7.2/10

Overall score

Score
7.2/ 10
✕
What it is
Our main score for this model, 1–10. It combines specs, expert reviews, best-of lists and owners.
How we count it
Parts: Technical score 40%, Reviews score 25%, List score 25%, Sentiment score 10%
Marks: Each part gets a mark out of 10. For reviews, lists and owners, a typical model in this category gets about 8 and the best one gets 10.
No data yet: A part with no data shows "?". It counts as the mark of a weaker model in this category (4 in 5 models with data score higher). This way, models with reviews, lists and owners usually come out ahead.
Score distribution
â–¼
<55-66-77-88-99-10
Score components

40%

6.5

Technical Score

25%

8.1

Reviews score

25%

?

List scoreNot enough data yet, so we use 7.5, the mark of a weaker model in this category

10%

6.5

Sentiment score

â–²Better than 68% of processors
7.6

Ratio quality/price

Ratio quality/price
7.6/ 10
✕
What it is
An indicator that combines the processor's overall rating with its cost.
When it matters
When you are looking for a processor with a good balance between performance, efficiency, and price.
Score distribution
â–¼
<55-66-77-88-99-10
Score components

70%

7.2

Overall score

30%

8.6

Price

â–²Better than 65%
6.5

Technical Score

Technical score
6.5/ 10
✕
What it is
How good the specs are compared with the other models in this category, 1–10.
How we count it
Areas: We rate the specs in each area against the other models in this category.
Weighting: The areas that matter most to buyers count more. The shares are shown under Score components.
Share: The technical score is 40% of the overall score.
Score distribution
â–¼
<55-66-77-88-99-10
Score components

60%

6.8

Performance

18%

5.8

Architecture

10%

7.2

Memory & PCIe

7%

4.1

Power & Thermal

4%

7.5

Platform

1%

4.0

Integrated graphics

â–²Better than 66%
8.1

Reviews score

Reviews score
8.1/ 10
✕
What it is
Average grade from independent test sites, magazines and video reviewers, 1–10.
How we count it
Grades: Each review's own score is converted to 1–10; without one, we grade the review ourselves. Big test sites count more, short reviews half as much as full tests. A video review counts half.
Score: The average grade is 80% of the review mark; the number of reviews is the other 20% (1 review = 5, the typical number in this category = 8, the most-reviewed model = 10).
Enough data: With few reviews, the average grade is pulled toward the typical grade of this category. No reviews yet: 7.1 for now.
Share: Reviews count 25% of the overall score.
Score distribution
â–¼
<55-66-77-88-99-10

80%

7.8

Average grade

20%

9.4

Popularity

Grades by review (36)
22 reviews: 11 with a printed score, 11 estimated from the review. 14 video reviews, each counting half as much as a written test. Reviews count 25% of the overall score.
User ratings collected online are not part of this score.
â–²Better than 76%
6.5

Sentiment score

Sentiment score
6.5/ 10
✕
What it is
How positive owners are about this model in their comments under video reviews and on forums. We read each comment, keep only people who say they own the model, and sort them into positive, mixed or negative.
How we count it
Score: We compare how satisfied this model’s owners are with the other models in this category: the typical model gets 8, the most satisfied tenth 10, the least satisfied 4. This is 80% of the owner mark; the number of owners is the other 20%.
Enough data: A model counts with 10+ owners from 4+ different discussions. With fewer, the owner part counts as 7.0 for now.
Share: Owners count 10% of the overall score (left out in categories where fewer than 10 models have enough owner comments).
Score distribution
â–¼
<55-66-77-88-99-10

6.5

Mark 6.8 is below the typical mark 8.0 of this category, so it cannot lift the score above the technical score

80%

6.9

Satisfaction

20%

6.3

Popularity

Owners (27)
27 owners from 17 online discussions
48% positive
11% mixed
41% negative
Category average: 61% positive
Our own analysis of online owner opinions, not a rating from any website.
â–¼Worse than 66%
?

List score

List score
7.5/ 10
✕
What it is
How often independent test sites, magazines and video reviewers put this model in their best-of lists for this category.
How we count it
Points: The model in the most lists of this category gets 10; the others get 8 to 10 in proportion. In no list yet: 7.5. Lists count 25% of the overall score.
Enough data: Every list counts, even a single one. With fewer than 5 best-of lists in the category, this part is left out.
Lists with this model (0)
Not in any best-of list yet, so this part counts as 7.5. Models in a list get 8 to 10.
Not in any best-of list yet
  • intel-core-i9-7900x
intel-core-i9-7900x
Where to Buy
*As an Amazon Associate, we earn from qualifying purchases.
Best Rankings
Available: ranking among products currently available (including other versions of this product).All: ranking among all products in the database.

What Reviewers Say About the Intel Core i9-7900X

Based on 10 · 15

Reviewers agree performance is outstanding with good overclocking, but it runs hot, draws heavy power and feels like poor value.
Praised
Mixed views
Criticised
Pick a topic to see who said what
Loading...
Loading category ranking...

Technical Specifications of Processor Intel Core i9-7900X

Technical Score
Technical score
6.5/ 10
✕
What it is
How good the specs are compared with the other models in this category, 1–10.
How we count it
Areas: We rate the specs in each area against the other models in this category.
Weighting: The areas that matter most to buyers count more. The shares are shown under Score components.
Share: The technical score is 40% of the overall score.
Score distribution
â–¼
<55-66-77-88-99-10
Score components:

60%

6.8

Performance

18%

5.8

Architecture

10%

7.2

Memory & PCIe

7%

4.1

Power & Thermal

4%

7.5

Platform

1%

4.0

Integrated graphics

6.5
Reviews score
8.1
Sentiment score
6.5
List score
?
Ratio quality/price
Value for money
7.6/ 10
✕
What it is
An indicator that combines the processor's overall rating with its cost.
When it matters
When you are looking for a processor with a good balance between performance, efficiency, and price.
Score distribution
â–¼
<55-66-77-88-99-10
Score components:

70%

7.2

Overall score

30%

8.6

Price

7.6
Processor type
workstation
This processor belongs to the workstation processor class, which is more advanced than that of 95.4% of processors and equal to that of 4.6% of processors.
CPU socket
LGA2066
This processor uses the LGA2066 CPU socket, which is newer than that of 73.4% of processors and equal to that of 1.4% of processors.
Chipset
X299
This processor supports X299 chipsets, which is broader compatibility than 95.5% of processors and equal to that of 1.5% of processors.
CPU architecture
x86-64
This processor uses the x86-64 architecture, which is more advanced than that of 1.8% of processors and equal to that of 98.2% of processors.
Instruction sets
SSE4.1, SSE4.2, AVX, AVX2, AVX-512
This processor supports SSE4.1, SSE4.2, AVX, AVX2, AVX-512 instruction sets, which is narrower support than 83.5% of processors and equal to that of 2.2% of processors.
Show more
What reviewers say
N. of physical cores
10
This processor has 10 CPU cores, which is more than 75.2% of processors and equal to 4.6% of processors.
CPU threads
20
This processor offers 20 CPU threads, which is more than 84.3% of processors and equal to 5% of processors.
CPU boost clock speed
4.5 GHz
This processor reaches a boost clock of 4.5 GHz which is higher than that of 53.9% of processors and equal to that of 5.5% of processors.
CPU base clock speed
10x 3.3 GHz
This processor has a base clock of 10x3.3 GHz which is higher than that of 87.5% of processors and equal to that of 0.1% of processors.
PassMark multi-core score
20,883
This processor scores 20,883 in PassMark, which is higher than 71.7% of processors.
Show more
What reviewers say
Semiconductor size
14 nm
This processor uses a 14 nm process node, which is older than that of 52% of processors and equal to that of 32.9% of processors.
Foundry
Intel 14 nm
This processor is built on the Intel 14 nm foundry process, which is less advanced than that of 55.9% of processors and equal to that of 29% of processors.
L3 cache
13.75 MB
This processor has an L3 cache of 13.75 MB which is larger than that of 61.4% of processors.
L2 cache
10 MB
This processor has an L2 cache of 10 MB which is larger than that of 79% of processors and equal to that of 1.8% of processors.
L1 cache
640 KB
This processor has an L1 cache of 640 KB which is larger than that of 73.6% of processors and equal to that of 3.1% of processors.
Show more
What reviewers say
DDR memory version
DDR4
This processor supports DDR DDR4, which is newer than that of 25.2% of processors and equal to that of 31.1% of processors.
Maximum memory speed
2,666 MHz
This processor supports memory speeds up to 2,666 MHz, which is lower than that of 56.7% of processors and equal to 7.9% of processors.
Max memory speed (JEDEC)
DDR4-2666 MHz
This processor supports JEDEC memory speeds up to DDR4-2666 MHz, which is lower than that of 59.8% of processors and equal to 7.8% of processors.
Max memory speed (XMP / EXPO)
2,666 MHz
This processor supports XMP/EXPO memory speeds up to 2,666 MHz, which is higher than that of 89.2% of processors and equal to 0.9% of processors.
Maximum memory capacity
128 GB
This processor supports up to 128 GB of memory, which is more than 59.3% of processors and equal to 22.8% of processors.
Show more
What reviewers say
Integrated graphics
no
This processor does not include integrated graphics. 85.4% of processors offer this.
Integrated GPU model
N/A
Integrated GPU execution units
N/A
Integrated GPU base frequency
N/A
Integrated media encoders/decoders
N/A
Show more
TDP (Thermal design power)
140 W
This processor has a TDP of 140 W which is higher than that of 94.9% of processors and equal to that of 0.8% of processors.
Base power (PL1)
140 W
This processor has a base power of 140 W which is higher than that of 95% of processors and equal to that of 0.7% of processors.
Boost power (PL2)
140 W
This processor has a boost power of 140 W which is higher than that of 79.1% of processors and equal to that of 1.6% of processors.
Tau (power duration limit)
?
Configurable TDP
no
This processor does not support configurable TDP. 53.7% of processors offer this.
Show more
What reviewers say

Intel Core i9-7900X vs the Average Processor

246810TotalPlatformPerformanceArchitectureMemory & PCIeIntegrated graphicsPower & Thermal
  • 6 more performance cores
    This processor has more performance cores than the average processor (10 vs 4). The average processor has 4 performance cores.
    10 vs 4
  • 12 more CPU threads
    This processor has more CPU threads than the average processor (20 vs 8). The average processor has 8 CPU threads.
    20 vs 8
  • 82.1% higher PassMark score
    This processor has a higher PassMark benchmark score than the average processor (20,883 vs 11,469). The average processor scores 11,469 in PassMark benchmark.
    20,883 vs 11,469
  • 28 more PCIe lanes
    This processor has more PCIe lanes than the average processor (44 vs 16). The average processor offers 16 PCIe lanes.
    44 vs 16
  • 4 more CPU cores
    This processor has more CPU cores than the average processor (10 vs 6). The average processor has 6 CPU cores.
    10 vs 6
  • 68.7% higher multi-core score
    This processor has a higher Geekbench 6 multi-core score than the average processor (8,787 vs 5,209). The average processor scores 5,209 in Geekbench 6 multi-core.
    8,787 vs 5,209
  • 88.5% better multi-core performance
    This processor has a higher multi-core performance than the average processor (5,286 vs 2,804.5). The average processor scores 2,804.5 in Cinebench R20 multi-core.
    5,286 vs 2,804.5
  • Unlocked for overclocking
    This processor has an unlocked multiplier, while the average processor does not. 22.6% of processors offer this.
  • 20.9% higher review score
    Reviews score
    8.1/ 10
    ✕
    What it is
    Average grade from independent test sites, magazines and video reviewers, 1–10.
    How we count it
    Grades: Each review's own score is converted to 1–10; without one, we grade the review ourselves. Big test sites count more, short reviews half as much as full tests. A video review counts half.
    Score: The average grade is 80% of the review mark; the number of reviews is the other 20% (1 review = 5, the typical number in this category = 8, the most-reviewed model = 10).
    Enough data: With few reviews, the average grade is pulled toward the typical grade of this category. No reviews yet: 7.1 for now.
    Share: Reviews count 25% of the overall score.
    Score distribution
    â–¼
    <55-66-77-88-99-10

    80%

    7.8

    Average grade

    20%

    9.4

    Popularity

    Grades by review (36)
    22 reviews: 11 with a printed score, 11 estimated from the review. 14 video reviews, each counting half as much as a written test. Reviews count 25% of the overall score.
    User ratings collected online are not part of this score.
    8.1 vs 6.7
  • Modern CPU socket
    This processor uses a more modern CPU socket than the average processor (LGA2066 vs FP5).
    LGA2066 vs FP5
  • Higher-end processor class
    This processor belongs to a higher-end processor class than the average processor (workstation vs mobile).
    workstation vs mobile
  • 6 more performance cores
    This processor has more performance cores than the average processor (10 vs 4). The average processor has 4 performance cores.
    10 vs 4
  • 12 more CPU threads
    This processor has more CPU threads than the average processor (20 vs 8). The average processor has 8 CPU threads.
    20 vs 8
  • 82.1% higher PassMark score
    This processor has a higher PassMark benchmark score than the average processor (20,883 vs 11,469). The average processor scores 11,469 in PassMark benchmark.
    20,883 vs 11,469
  • 4 more CPU cores
    This processor has more CPU cores than the average processor (10 vs 6). The average processor has 6 CPU cores.
    10 vs 6
  • 68.7% higher multi-core score
    This processor has a higher Geekbench 6 multi-core score than the average processor (8,787 vs 5,209). The average processor scores 5,209 in Geekbench 6 multi-core.
    8,787 vs 5,209
  • 88.5% better multi-core performance
    This processor has a higher multi-core performance than the average processor (5,286 vs 2,804.5). The average processor scores 2,804.5 in Cinebench R20 multi-core.
    5,286 vs 2,804.5
  • Unlocked for overclocking
    This processor has an unlocked multiplier, while the average processor does not. 22.6% of processors offer this.
  • Higher base clock
    This processor has a higher base clock than the average processor (10x3.3 GHz vs 4x3.4 GHz).
    10x3.3 GHz vs 4x3.4 GHz
  • More advanced Turbo Core
    This processor has a more advanced Turbo Core version than the average processor (3 vs 2).
    Intel Turbo Boost Max Technology 3
    3.0 vs 2.0
  • 3.33x larger L2 cache
    This processor has a higher L2 cache than the average processor (10 MB vs 3 MB). The average processor has L2 cache of 3 MB.
    10 MB vs 3 MB
  • 2x more L2 per core
    This processor has more L2 cache per core than the average processor (1 MB/core vs 0.5 MB/core). The average processor provides 0.5 MB/core of L2 cache per core.
    1 MB/core vs 0.5 MB/core
  • 66.7% larger L1 cache
    This processor has a higher L1 cache than the average processor (640 KB vs 384 KB). The average processor has L1 cache of 384 KB.
    640 KB vs 384 KB
  • 28 more PCIe lanes
    This processor has more PCIe lanes than the average processor (44 vs 16). The average processor offers 16 PCIe lanes.
    44 vs 16
  • 81.2% higher memory bandwidth
    This processor has a higher memory bandwidth than the average processor (85 GB/s vs 46.9 GB/s). The average processor offers memory bandwidth of 46.9 GB/s.
    85 GB/s vs 46.9 GB/s
  • Supports memory overclocking
    This processor supports memory overclocking, while the average processor does not. 43.9% of processors support memory overclocking.
  • 2x more memory capacity
    This processor has more maximum memory capacity than the average processor (128 GB vs 64 GB). The average processor supports 64 GB of memory.
    128 GB vs 64 GB
  • 5 °C lower CPU temperature
    This processor has a lower CPU temperature than the average processor (95 °C vs 100 °C). The average processor runs at a CPU temperature of 100 °C.
    95 °C vs 100 °C
  • No configurable TDP
    This processor does not support configurable TDP, while the average processor does. 53.7% of processors support configurable TDP.
  • 3.11x higher base power
    This processor has a higher base power draw than the average processor (140 W vs 45 W). The average processor has a base power draw of 45 W.
    140 W vs 45 W
  • Weaker security extensions
    This processor provides less advanced security extensions than the average processor (AES-NI, NX bit, TXT vs AES-NI, NX bit, Secure Key, TXT, OS Guard, Boot Guard, CET, MBEC, TME, TME-MK).
    AES-NI, NX bit, TXT vs AES-NI, NX bit, Secure Key, TXT, OS Guard, Boot Guard, CET, MBEC, TME, TME-MK
  • Narrower instruction support
    This processor supports a narrower instruction set than the average processor (SSE4.1, SSE4.2, AVX, AVX2, AVX-512 vs MMX, SSE, SSE2, SSE3, SSSE3, SSE4A, SSE4.1, SSE4.2, AVX, AVX2, F16C, FMA3, AES, SHA, AMD-V).
    SSE4.1, SSE4.2, AVX, AVX2, AVX-512 vs MMX, SSE, SSE2, SSE3, SSSE3, SSE4A, SSE4.1, SSE4.2, AVX, AVX2, F16C, FMA3, AES, SHA, AMD-V
  • 2.19x higher boost power
    This processor has a higher boost power draw than the average processor (140 W vs 64 W). The average processor has a boost power draw of 64 W.
    140 W vs 64 W
  • 56.8% slower Blender rendering
    This processor has a higher Blender BMW27 render time than the average processor (172 vs 398). The average processor needs 398.015 for the Blender BMW27 test.
    172 vs 398.015
  • 84.2% larger die size
    This processor has a higher die size than the average processor (326 mm² vs 177 mm²). The average processor has a die size of 177 mm².
    326 mm² vs 177 mm²
  • 25.7% less L3 per core
    This processor has less L3 cache per core than the average processor (1.4 MB/core vs 1.85 MB/core). The average processor provides 1.85 MB/core of L3 cache per core.
    1.375 MB/core vs 1.85 MB/core
  • 2.57x more expensive
    Intel Core i9-7900X is more expensive than the average processor ($360 vs $140).
    $360 vs $140
  • 9.7% lower sentiment score
    Sentiment score
    6.5/ 10
    ✕
    What it is
    How positive owners are about this model in their comments under video reviews and on forums. We read each comment, keep only people who say they own the model, and sort them into positive, mixed or negative.
    How we count it
    Score: We compare how satisfied this model’s owners are with the other models in this category: the typical model gets 8, the most satisfied tenth 10, the least satisfied 4. This is 80% of the owner mark; the number of owners is the other 20%.
    Enough data: A model counts with 10+ owners from 4+ different discussions. With fewer, the owner part counts as 7.0 for now.
    Share: Owners count 10% of the overall score (left out in categories where fewer than 10 models have enough owner comments).
    Score distribution
    â–¼
    <55-66-77-88-99-10

    6.5

    Mark 6.8 is below the typical mark 8.0 of this category, so it cannot lift the score above the technical score

    80%

    6.9

    Satisfaction

    20%

    6.3

    Popularity

    Owners (27)
    27 owners from 17 online discussions
    48% positive
    11% mixed
    41% negative
    Category average: 61% positive
    Our own analysis of online owner opinions, not a rating from any website.
    6.5 vs 7.2
  • Narrower instruction support
    This processor supports a narrower instruction set than the average processor (SSE4.1, SSE4.2, AVX, AVX2, AVX-512 vs MMX, SSE, SSE2, SSE3, SSSE3, SSE4A, SSE4.1, SSE4.2, AVX, AVX2, F16C, FMA3, AES, SHA, AMD-V).
    SSE4.1, SSE4.2, AVX, AVX2, AVX-512 vs MMX, SSE, SSE2, SSE3, SSSE3, SSE4A, SSE4.1, SSE4.2, AVX, AVX2, F16C, FMA3, AES, SHA, AMD-V
  • Weaker security extensions
    This processor provides less advanced security extensions than the average processor (AES-NI, NX bit, TXT vs AES-NI, NX bit, Secure Key, TXT, OS Guard, Boot Guard, CET, MBEC, TME, TME-MK).
    AES-NI, NX bit, TXT vs AES-NI, NX bit, Secure Key, TXT, OS Guard, Boot Guard, CET, MBEC, TME, TME-MK
  • 3 years older release date
    This processor has an older release date than the average processor (2017 vs 2020).
    June 2017
    2017 vs 2020
  • More limited crypto acceleration
    This processor offers more limited crypto acceleration than the average processor (AES vs AES, SHA).
    AES vs AES, SHA
  • 56.8% slower Blender rendering
    This processor has a higher Blender BMW27 render time than the average processor (172 vs 398). The average processor needs 398.015 for the Blender BMW27 test.
    172 vs 398.015
  • 6.8% lower single-core score
    This processor has a lower Geekbench 6 single-core score than the average processor (1,431 vs 1,535). The average processor scores 1,535 in Geekbench 6 single-core.
    1,431 vs 1,535
  • 84.2% larger die size
    This processor has a higher die size than the average processor (326 mm² vs 177 mm²). The average processor has a die size of 177 mm².
    326 mm² vs 177 mm²
  • 25.7% less L3 per core
    This processor has less L3 cache per core than the average processor (1.4 MB/core vs 1.85 MB/core). The average processor provides 1.85 MB/core of L3 cache per core.
    1.375 MB/core vs 1.85 MB/core
  • 16.7% larger process node
    This processor has a higher process node than the average processor (14 nm vs 12 nm). The average processor uses a process node of 12 nm.
    14 nm vs 12 nm
  • Less advanced microarchitecture
    This processor uses a less advanced microarchitecture than the average processor (Skylake vs Kaby Lake).
    Skylake vs Kaby Lake
  • Limited PCIe bifurcation
    This processor supports less flexible PCIe bifurcation than the average processor (x16, x8/x4/x4 vs x16, x8/x8, x4/x4/x4/x4).
    x16, x8/x4/x4 vs x16, x8/x8, x4/x4/x4/x4
  • 16.7% lower memory speed
    This processor has a lower maximum memory speed than the average processor (2,666 MHz vs 3,200 MHz). The average processor supports memory speed of 3,200 MHz.
    2,666 MHz vs 3,200 MHz
  • 2 fewer memory channels
    This processor has fewer memory channels than the average processor (4 vs 2). The average processor supports 2 memory channels.
    4 vs 2
  • Lower JEDEC memory speed
    This processor has a lower JEDEC memory speed than the average processor (DDR4-2666 MHz vs DDR4-3200 MHz). The average processor supports JEDEC memory speed of DDR4-3200 MHz.
    DDR4-2,666 MHz vs DDR4-3,200 MHz
  • No integrated graphics
    This processor does not include integrated graphics, while the average processor does. 85.4% of processors include integrated graphics.
  • No configurable TDP
    This processor does not support configurable TDP, while the average processor does. 53.7% of processors support configurable TDP.
  • 3.11x higher base power
    This processor has a higher base power draw than the average processor (140 W vs 45 W). The average processor has a base power draw of 45 W.
    140 W vs 45 W
  • 2.19x higher boost power
    This processor has a higher boost power draw than the average processor (140 W vs 64 W). The average processor has a boost power draw of 64 W.
    140 W vs 64 W
  • 3.11x higher TDP
    This processor has a higher TDP than the average processor (140 W vs 45 W). The average processor has a TDP of 45 W.
    140 W vs 45 W
  • 5 °C lower temperature limit
    This processor has a lower temperature limit than the average processor (95 °C vs 100 °C). The average processor can run up to 100 °C.
    95 °C vs 100 °C

Video Reviews

Hands-on testing, unboxing, and real-world video evaluations

8.0
Ethically Sourced Hardware
≈ estimated
22/06/2025
Hands-on review · gaming and productivity build tests
Verdict
Intel Core i9-7900X is surprisingly capable for 1080p gaming and productivity, though the platform is overpriced.
8.0
Overclock
≈ estimated
29/08/2017
Hands-on review · benchmarks, power and temperature tests
Verdict
Intel Core i9-7900X is a great CPU, though pricey, with strong multi-threaded speed but high heat and power draw.
7.0
MindBlank Tech
≈ estimated
21/08/2017
Hands-on review · benchmarks, gaming and power tests
Verdict
Intel Core i9-7900X is fast and capable but hard to justify at this price unless you run heavily multi-threaded workloads.
8.0
BPS Customs
≈ estimated
18/08/2017
Hands-on review · performance, heat and power tests
Verdict
Intel Core i9-7900X is Intel's strongest consumer chip, but it runs hot, draws lots of power and is not for budget builders.
9.0
Tally Ho Tech
≈ estimated
18/07/2017
Hands-on review · air cooling and overclocking tests
Verdict
Intel Core i9-7900X is probably the best processor available: quiet on air at stock but hot when overclocked.
7.0
PC Centric
≈ estimated
16/07/2017
Hands-on review · gaming benchmarks, overclocking and thermals
Verdict
Intel Core i9-7900X performs very well with 10 cores, but thermal throttling limits overclocking and the competition is strong.
4.0
Greg Salazar
≈ estimated
11/07/2017
Benchmark review · gaming, streaming and overclocking tests
Verdict
Intel Core i9-7900X is not worth buying for gaming or content creation, as it is costly and loses to cheaper chips.
8.0
KitGuruTech
≈ estimated
01/07/2017
Hands-on review · overclocking, thermals and value analysis
Verdict
Intel Core i9-7900X is superb for enthusiasts who want the best, but it is power-hungry, hot and poor value.
6.0
Hardware Unboxed
≈ estimated
27/06/2017
Overclocking test · thermals and cooling needs
Verdict
Intel Core i9-7900X overclocks well with serious cooling, but poor thermals and cost make it hard to recommend now.
5.0
Hardware Unboxed
≈ estimated
23/06/2017
Hands-on review · benchmarks, power and value
Verdict
Intel Core i9-7900X performs excellently, but its heat, power draw and price make the platform hard to recommend right now.
7.0
TWiT Tech Podcast Network
≈ estimated
22/06/2017
Podcast discussion · benchmarks and AMD comparison
Verdict
Intel Core i9-7900X is better than expected, but pricey and power hungry, so waiting for Threadripper may be wise.
8.0
PC Perspective
≈ estimated
19/06/2017
Hands-on review · benchmarks, overclocking and power draw
Verdict
Intel Core i9-7900X delivers surprisingly good performance for the price, but weaker 1080p gaming and high power draw suggest Threadripper may be worth waiting for.
More graded video reviews (1)
creator’s own scoreestimated by us

Expert Reviews

In-depth analysis and verdict from leading tech publications

6.0
tomshardware.com
≈ estimated
7/6/2018
Lab test · Workstation performance
Verdict
The Intel Core i9-7900X is strong for rendering and content creation, but it trails the older Core i7-6950X in several games and runs hot.
8.0
pcmag.com
✓ explicit
11/6/2018
Lab test · Overclocking and gaming
Verdict
The Intel Core i9-7900X is fast at video encoding and rendering, but it runs hot when overclocked and trails the Core i7-7700K in some 1080p games.
7.0
arstechnica.com
≈ estimated
4/7/2017
Lab test · Gaming and productivity
Verdict
The Intel Core i9-7900X is very fast at multithreaded rendering and encoding, but uneven gaming results and heat make it a poor fit for most buyers.
8.0
uk.pcmag.com
✓ explicit
6/6/2019
Lab test · Workstation and gaming
Verdict
The Intel Core i9-7900X is a very fast 10-core chip for editing and rendering, but it runs hot and is a poor pick for Full HD gaming.
10
techpowerup.com
✓ explicit
5/11/2019
Benchmark page · Web performance
Verdict
The Intel Core i9-7900X review page covers only browser benchmarks, with no results or verdict shown.
9.0
impulsegamer.com
✓ explicit
4/11/2020
Real-world test · Photo and image work
Verdict
The Intel Core i9-7900X cut 3D photo modeling and star-stacking times in the author's tests, suiting it to heavy, time-critical work.
9.2
tweaktown.com
✓ explicit
7/6/2018
Hands-on test · Architecture and motherboards
Verdict
The Intel Core i9-7900X is a 10-core, 20-thread workstation chip with a new mesh layout and bigger L2 cache, but it needs a new motherboard.
7.0
techadvisor.com
✓ explicit
9/8/2017
Benchmark review · Enthusiast desktop CPU
Verdict
The Intel Core i9-7900X is the fastest stock consumer chip tested, but it needs a new motherboard and a large cooler to avoid overheating.
7.0
computerbase.de
≈ estimated
7/6/2018
Lab test · Power and temperature
Verdict
The Intel Core i9-7900X is very fast in multi-threaded work, but it draws 80 to 100 watts more and runs 20 to 35 degrees hotter than the Core i7-6950X.
9.7
gamestar.de
✓ explicit
7/7/2017
Lab test · Gaming and mesh design
Verdict
The Intel Core i9-7900X adds ten cores and a new mesh layout, but its turbo and AVX-512 gains matter little for most games.
8.0
pcwelt.de
≈ estimated
2/7/2019
Lab test · Overclocking
Verdict
The Intel Core i9-7900X is strong in multi-core work and overclocks well, but it runs warm and draws more power than the older i7-6950X.
8.0
notebookcheck.com
≈ estimated
2/8/2017
Lab test · Geekbench results
Verdict
The Intel Core i9-7900X was the fastest available Skylake-X chip at the time, beating the i7-6950X in multi-core work but trailing newer high-core chips.
7.8
computerbild.de
✓ explicit
6/6/2019
Lab test · Speed and power use
Verdict
The Intel Core i9-7900X is the fastest chip tested, about 35% quicker overall than the Core i7-6950X, but it draws 48W more under full load.
9.0
chip.de
≈ estimated
12/2/2019
Benchmark test · High-end desktop CPU
Verdict
The Intel Core i9-7900X suits anyone who needs maximum processing power, beating the i7-6950X in most tests but not all.
7.0
tomshardware.fr
≈ estimated
8/6/2018
Lab test · Core-to-core speed
Verdict
The Intel Core i9-7900X is very fast in many tasks, but its new mesh interconnect makes it slower in some games than the Core i7-6950X.
8.0
lesnumeriques.com
✓ explicit
5/9/2019
Lab test · Ten-core desktop CPU
Verdict
The Intel Core i9-7900X is fast at 3D rendering and video encoding thanks to its ten cores, but it is weaker in games and lightly threaded apps.
9.0
59hardware.net
≈ estimated
6/8/2018
Benchmark roundup · Skylake-X desktop CPU
Verdict
The Intel Core i9-7900X is a 10-core chip that wins many benchmarks, though its specifications stay close to the previous generation.
9.0
geeknetic.es
≈ estimated
8/7/2017
Lab test · Ten-core X299 CPU
Verdict
The Intel Core i9-7900X offers ten cores and strong overclocking on the X299 platform, but it runs hot and lacks fast USB 3.1 Gen2 ports.
8.8
profesionalreview.com
✓ explicit
7/6/2018
Hands-on test · Overclocking
Verdict
The Intel Core i9-7900X suits enthusiasts who both game and create content, though it runs hot when pushed past 4.2 GHz.

Third-Party Reviews

What Customers Like About Intel Core i9-7900X

  • High core count (10 cores and 20 threads) provides exceptional multi-threaded performance for workstation tasks like video transcoding, rendering, and content creation.
  • Fast single-threaded performance with a high turbo clock speed of up to 4.5GHz, making it suitable for high-refresh-rate gaming when properly tuned.
  • Significant price decrease compared to its 10-core predecessor (i7-6950X), offering better performance at a much lower launch MSRP.
  • Provides 44 PCIe lanes, allowing for extensive connectivity and high-speed NVMe SSD RAID configurations on compatible X299 motherboards.
  • Excellent overclocking potential for enthusiasts, with some users reaching 4.7GHz or even 5GHz across all cores when using high-end cooling solutions.
  • Native support for AVX-512 instructions, which can significantly accelerate specific professional and scientific workloads.

What Customers Don't Like About Intel Core i9-7900X

  • Runs extremely hot under load due to high power consumption and the use of thermal interface material (TIM) instead of solder under the heat spreader.
  • Requires high-end, expensive cooling solutions (typically large AIOs or custom water loops) to avoid thermal throttling, especially when overclocked.
  • Gaming performance at 1080p can sometimes be inconsistent or lower than mainstream processors like the i7-7700K due to increased latency from the mesh architecture.
  • Relatively high platform entry cost, requiring a new and often expensive X299 chipset motherboard and quad-channel DDR4 memory.
  • Significant power draw, with some systems pulling over 200W under heavy encoding loads, leading to higher energy costs and heat output.
  • Lacks support for Intel SGX, which prevents the playback of 4K Blu-ray discs on systems using this processor and the X299 platform.

Verdict

The Intel Core i9-7900X is a high-performance Skylake-X enthusiast processor featuring 10 cores and 20 threads with a 3.3 GHz base clock and a 4.5 GHz Max Turbo 3.0 frequency. Built on a 14nm process for the LGA 2066 socket, it offers 44 PCIe lanes, 13.75MB of L3 cache, and quad-channel DDR4-2666 memory support with a 140W TDP. Its main strengths include exceptional multi-threaded performance for workstation tasks like video encoding and 3D rendering, significant IPC gains over previous generations, and high overclocking headroom. However, the processor is known for extremely high power consumption under load, high operating temperatures due to the use of thermal paste instead of solder under the heat spreader, and the requirement for an expensive X299 motherboard.

Compare Intel Core i9-7900X With Other Processors

1Product to compare no. 1
VS
2Product to compare no. 2
VS
3Product to compare no. 3 (optional)

Graphic Comparison of Intel Core i9-7900X and Other Processors

No results found