Scored using Projectors Methodology v3.0
Projectors Methodology v3.0
Mathematical & Unbiased Scoring
Products in this category are scored under Frontum Projectors Methodology v3.0: the technical score from the specifications is the base, and independent expert and video reviews (up to ±0.5 points), owner opinions (up to ±0.3) and best-of lists (up to +0.3) move it up or down.
Explore Projectors Methodology v3.0

NexiGo TriVision Ultra Review: 86 Specs Compared

Avg. price:~$1,300Native panel resolution:1920x1080ANSI lumens:2600Throw ratio:1.27:1Lamp life:25000 hours

NexiGo TriVision Ultra Review: Compare 86 technical specifications, 5 expert and video reviews and 2 best-of lists to see how this product ranks in the Projectors category and whether it is worth buying.
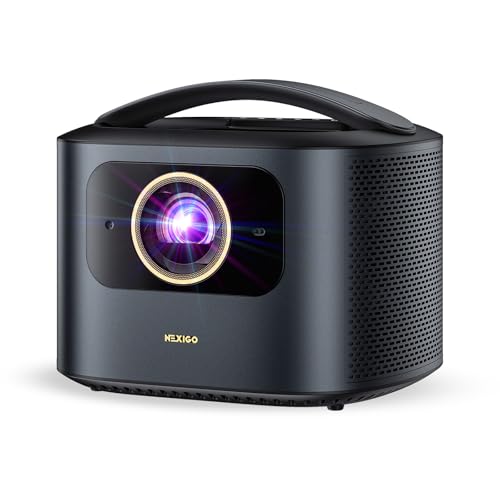
NexiGo TriVision Ultra
8.1/10

Overall score

Score
8.1/ 10
✕
What it is
Our main score for this model, 1–10. It combines specs, best-of lists, expert reviews and owners.
How we count it
Parts: Technical score 35%, List score 30%, Reviews score 25%, Sentiment score 10%
Marks: Each part gets a mark out of 10. For reviews, lists and owners, a typical model in this category gets about 8 and the best one gets 10.
No data yet: A part with no data shows "?". It counts as the mark of a weaker model in this category (4 in 5 models with data score higher). This way, models with reviews, lists and owners usually come out ahead.
Score distribution
▼
<55-66-77-88-99-10
Score components

35%

8.4

Technical Score

30%

8.2

List score

25%

8.1

Reviews score

10%

?

Sentiment scoreNot enough data yet, so we use 6.8, the mark of a weaker model in this category

★Better than 93% of projectors
6.8

Ratio quality/price

Ratio quality/price
6.8/ 10
✕
What it is
An indicator that combines the projector's overall rating with its cost.
When it matters
When you are looking for a projector with a good balance between quality and price.
Score distribution
▼
<55-66-77-88-99-10
Score components

70%

8.1

Overall score

30%

3.6

Price

▲Better than 54%
8.4

Technical Score

Technical score
8.4/ 10
✕
What it is
How good the specs are compared with the other models in this category, 1–10.
How we count it
Areas: We rate the specs in each area against the other models in this category.
Weighting: The areas that matter most to buyers count more. The shares are shown under Score components.
Share: The technical score is 35% of the overall score.
Score distribution
▼
<55-66-77-88-99-10
Score components

42%

8.9

Image Quality

22%

7.6

Projection & Lens

12%

8.8

HDMI & Gaming

10%

7.7

Audio & Features

8%

9.1

Connectivity

6%

7.6

Design & Power

★Better than 98%
8.1

Reviews score

Reviews score
8.1/ 10
✕
What it is
Average grade from independent test sites, magazines and video reviewers, 1–10.
How we count it
Grades: Each review's own score is converted to 1–10; without one, we grade the review ourselves. Big test sites count more, short reviews half as much as full tests. A video review counts half.
Score: The average grade is 80% of the review mark; the number of reviews is the other 20% (1 review = 5, the typical number in this category = 8, the most-reviewed model = 10).
Enough data: With few reviews, the average grade is pulled toward the typical grade of this category. No reviews yet: 7.8 for now.
Share: Reviews count 25% of the overall score.
Score distribution
▼
<55-66-77-88-99-10

80%

8.3

Average grade

20%

7.2

Popularity

Grades by review (5)
2 reviews: 1 with a printed score, 1 estimated from the review. 3 video reviews, each counting half as much as a written test. Reviews count 25% of the overall score.
User ratings collected online are not part of this score.
▼Worse than 51%
?

Sentiment score

Sentiment score
6.8/ 10
✕
What it is
How positive owners are about this model in their comments under video reviews and on forums. We read each comment, keep only people who say they own the model, and sort them into positive, mixed or negative.
How we count it
Score: We compare how satisfied this model’s owners are with the other models in this category: the typical model gets 8, the most satisfied tenth 10, the least satisfied 4. This is 80% of the owner mark; the number of owners is the other 20%.
Enough data: A model counts with 10+ owners from 4+ different discussions. With fewer, the owner part counts as 6.8 for now.
Share: Owners count 10% of the overall score (left out in categories where fewer than 10 models have enough owner comments).
Score distribution
▼
<55-66-77-88-99-10
Owners (8)
Not enough owner comments yet (10+ owners from 4+ discussions needed), so the owner part counts as 6.8 for now.
Our own analysis of online owner opinions, not a rating from any website.
Not enough owner comments yet
8.2

List score

List score
8.2/ 10
✕
What it is
How often independent test sites, magazines and video reviewers put this model in their best-of lists for this category.
How we count it
Points: The model in the most lists of this category gets 10; the others get 8 to 10 in proportion. In no list yet: 7.5. Lists count 30% of the overall score.
Enough data: Every list counts, even a single one. With fewer than 5 best-of lists in the category, this part is left out.
Lists with this model (2)
List score: in 2 of 99 lists (2%)
▲Better than 76%
  • nexigo-trivision-ultra
  • nexigo-trivision-ultra
  • nexigo-trivision-ultra
  • nexigo-trivision-ultra
  • nexigo-trivision-ultra
  • nexigo-trivision-ultra
  • nexigo-trivision-ultra
  • nexigo-trivision-ultra
  • nexigo-trivision-ultra
nexigo-trivision-ultra
Where to Buy
*As an Amazon Associate, we earn from qualifying purchases.
Best Rankings
Available: ranking among products currently available (including other versions of this product).All: ranking among all products in the database.

What Reviewers Say About the NexiGo TriVision Ultra

Based on 2 · 3

Gamers appreciate the responsive feel and strong brightness, but blacks look grayish and the streaming apps disappoint.
Praised
Criticised
Pick a topic to see who said what
Loading...
Loading category ranking...

Projectors model ranking

Ranked #39 of 543 models in Projectors (Overall score)

Technical Specifications of Projector NexiGo TriVision Ultra

Technical Score
Technical score
8.4/ 10
✕
What it is
How good the specs are compared with the other models in this category, 1–10.
How we count it
Areas: We rate the specs in each area against the other models in this category.
Weighting: The areas that matter most to buyers count more. The shares are shown under Score components.
Share: The technical score is 35% of the overall score.
Score distribution
▼
<55-66-77-88-99-10
Score components:

42%

8.9

Image Quality

22%

7.6

Projection & Lens

12%

8.8

HDMI & Gaming

10%

7.7

Audio & Features

8%

9.1

Connectivity

6%

7.6

Design & Power

8.4
Reviews score
8.1
Sentiment score
?
List score
8.2
Ratio quality/price
Value for money
6.8/ 10
✕
What it is
An indicator that combines the projector's overall rating with its cost.
When it matters
When you are looking for a projector with a good balance between quality and price.
Score distribution
▼
<55-66-77-88-99-10
Score components:

70%

8.1

Overall score

30%

3.6

Price

6.8
ANSI lumens
2,600
This projector reaches 2,600 ANSI lumens, brighter than 56.8% of projectors and equal to 1.7% of projectors.
Contrast ratio
100,000:1
This projector has a contrast ratio of 100000:1, higher than 73.1% of projectors and equal to 3.5% of projectors.
Dynamic contrast ratio.
Native panel resolution
1920x1080
This projector uses a native resolution of 1920x1080, higher than 27% of projectors and equal to 59.2% of projectors.
Uses XPR pixel-shifting for 4K output.
Output resolution
3840x2160
This projector supports output resolution up to 3840x2160, higher than 71.2% of projectors and equal to 24.6% of projectors.
Projection technology
DLP
Show more
What reviewers say
Throw ratio
1.27:1
Min throw distance
3.5 ft
This projector needs a minimum throw distance of 3.5 ft, longer than 52.2% of projectors and equal to 2.8% of projectors.
Max projection size
300 inch
This projector supports projection sizes up to 300 inch, larger than 51.5% of projectors and equal to 38% of projectors.
Zoom ratio
N/A
Motorized zoom
no
This projector does not have motorized zoom. 14.8% of projectors offer this.
Show more
Input lag
8 ms
This projector has input lag of 8 ms, lower than 88.5% of projectors and equal to 1.2% of projectors.
At 1080P/240Hz.
Auto low latency mode (ALLM)
yes
This projector switches to low-latency mode automatically for games. 84.1% of projectors offer this.
Variable refresh rate (VRR)
no
This projector does not support variable refresh rate. 1.8% of projectors offer this.
HDMI version
2.1
This projector supports HDMI 2.1, more modern than 82.2% of projectors and equal to 17.8% of projectors.
Different HDMI ports use 2.1 and 2.
Max HDMI bandwidth
32 Gbps
This projector supports HDMI bandwidth up to 32 Gbps, higher than 89.4% of projectors and equal to 0.6% of projectors.
Show more
What reviewers say
N. of HDMI ports
3
This projector has 3 HDMI port/s, more than 93.3% of projectors and equal to 6.4% of projectors.
Wi-Fi connectivity
yes
This projector connects to Wi-Fi networks for streaming. 46.7% of projectors offer this.
Wi-Fi version
Wi-Fi 6 (802.11ax)
This projector uses Wi-Fi 6 (802.11ax), which is newer than 83.1% of projectors and the same as in 14.9% of projectors.
Bluetooth connectivity
yes
This projector supports Bluetooth for speakers and headphones. 49.4% of projectors offer this.
Bluetooth version
5.2
This projector supports Bluetooth 5.2, more modern than 87.1% of projectors and equal to 7.4% of projectors.
Show more
Smart TV features
yes
This projector has built-in smart TV features. 56.2% of projectors offer this.
Fire TV included.
Operating system
none
Android OS
no
This projector does not run Android OS. 19.1% of projectors run Android OS.
Dedicated smartphone app
no
This projector does not come with a dedicated smartphone app. 36.8% of projectors come with a dedicated smartphone app.
Remote control
yes
This projector includes a remote control. 1.5% of projectors offer this.
Show more
What reviewers say
Light source type
hybrid
This projector uses hybrid light source technology, more advanced than 73.6% of projectors and equal to 1.7% of projectors.
Tri-LED-Laser.
Laser light source
yes
This projector has a laser light source. 73.3% of projectors offer this.
Lamp life
25,000 hours
This projector offers lamp life of 25,000 hours, shorter than 61.1% of projectors and equal to 6.8% of projectors.
Lamp life (eco mode)
?
Operating power consumption
300 W
This projector uses 300 W of power, more than 69.9% of projectors and equal to 3.2% of projectors.
Show more

NexiGo TriVision Ultra vs the Average Projector

246810TotalImage QualityProjection & LensHDMI & GamingConnectivityAudio & FeaturesDesign & Power
  • Wider color gamut
    This projector has a higher color gamut coverage than the average projector (110% BT.2020 % vs 99% Rec.709 %). The average projector has 99% Rec.709 % of color gamut coverage.
    110% BT.2,020 % vs 99% Rec.709 %
  • Higher output resolution
    This projector supports a higher output resolution than the average projector (3840x2160 vs 1920x1080). The average projector outputs at 1920x1080 resolution.
    3840x2160 vs 1920x1080
  • Supports Dolby Vision
    This projector supports Dolby Vision, while the average projector does not. 7.2% of projectors support Dolby Vision.
  • Advanced focus control
    This projector offers Advanced focus control than the average projector (auto-focus vs manual). The average projector uses manual focus control.
    Manual remote fine-tuning available.
    auto-focus vs manual
  • 2.82x higher refresh rate
    This projector has a higher refresh rate than the average projector (240 Hz vs 85 Hz). The average projector has 85 Hz of refresh rate.
    240 Hz vs 85 Hz
  • Higher contrast ratio
    This projector has a higher contrast ratio than the average projector (100000:1 vs 10000:1). The average projector has 10000:1 of contrast ratio.
    Dynamic contrast ratio.
    100,000:1 vs 10,000:1
  • Supports HDR10+
    This projector supports HDR10+, while the average projector does not. 15.2% of projectors support HDR10+.
  • Supports auto low-latency mode
    This projector switches to low-latency mode automatically, while the average projector does not. 16% of projectors offer this.
  • 9.5% higher review score
    Reviews score
    8.1/ 10
    ✕
    What it is
    Average grade from independent test sites, magazines and video reviewers, 1–10.
    How we count it
    Grades: Each review's own score is converted to 1–10; without one, we grade the review ourselves. Big test sites count more, short reviews half as much as full tests. A video review counts half.
    Score: The average grade is 80% of the review mark; the number of reviews is the other 20% (1 review = 5, the typical number in this category = 8, the most-reviewed model = 10).
    Enough data: With few reviews, the average grade is pulled toward the typical grade of this category. No reviews yet: 7.8 for now.
    Share: Reviews count 25% of the overall score.
    Score distribution
    ▼
    <55-66-77-88-99-10

    80%

    8.3

    Average grade

    20%

    7.2

    Popularity

    Grades by review (5)
    2 reviews: 1 with a printed score, 1 estimated from the review. 3 video reviews, each counting half as much as a written test. Reviews count 25% of the overall score.
    User ratings collected online are not part of this score.
    8.1 vs 7.4
  • 6.5% higher list score
    List score
    8.2/ 10
    ✕
    What it is
    How often independent test sites, magazines and video reviewers put this model in their best-of lists for this category.
    How we count it
    Points: The model in the most lists of this category gets 10; the others get 8 to 10 in proportion. In no list yet: 7.5. Lists count 30% of the overall score.
    Enough data: Every list counts, even a single one. With fewer than 5 best-of lists in the category, this part is left out.
    Lists with this model (2)
    List score: in 2 of 99 lists (2%)
    8.2 vs 7.7
  • Wider color gamut
    This projector has a higher color gamut coverage than the average projector (110% BT.2020 % vs 99% Rec.709 %). The average projector has 99% Rec.709 % of color gamut coverage.
    110% BT.2,020 % vs 99% Rec.709 %
  • Higher output resolution
    This projector supports a higher output resolution than the average projector (3840x2160 vs 1920x1080). The average projector outputs at 1920x1080 resolution.
    3840x2160 vs 1920x1080
  • Supports Dolby Vision
    This projector supports Dolby Vision, while the average projector does not. 7.2% of projectors support Dolby Vision.
  • Higher contrast ratio
    This projector has a higher contrast ratio than the average projector (100000:1 vs 10000:1). The average projector has 10000:1 of contrast ratio.
    Dynamic contrast ratio.
    100,000:1 vs 10,000:1
  • 2.82x higher refresh rate
    This projector has a higher refresh rate than the average projector (240 Hz vs 85 Hz). The average projector has 85 Hz of refresh rate.
    240 Hz vs 85 Hz
  • Supports HDR10+
    This projector supports HDR10+, while the average projector does not. 15.2% of projectors support HDR10+.
  • Supports pixel shifting
    This projector supports pixel shifting, while the average projector does not. 26.6% of projectors support pixel shifting.
    Via XPR technology.
  • Supports HLG
    This projector supports HLG, while the average projector does not. 41.2% of projectors support HLG.
  • 18.2% brighter image
    This projector has higher ANSI lumens than the average projector (2,600 vs 2,200). The average projector has 2,200 ANSI lumens.
    2,600 vs 2,200
  • 4 more recent release
    This projector was released more recently than the average projector (2025 vs 2021). The average projector was released in 2021.
    January 2025
    2,025 vs 2,021
  • Advanced focus control
    This projector offers Advanced focus control than the average projector (auto-focus vs manual). The average projector uses manual focus control.
    Manual remote fine-tuning available.
    auto-focus vs manual
  • Supports auto keystone correction
    This projector corrects keystone distortion automatically, while the average projector does not. 36.9% of projectors offer this.
  • 10 degrees more vertical correction
    This projector offers more vertical keystone correction than the average projector (40 degrees vs 30 degrees). The average projector offers vertical keystone correction of 30 degrees.
    40 degrees vs 30 degrees
  • 50 inch larger image size
    This projector has a higher projection size than the average projector (300 inch vs 250 inch). The average projector has 250 inch of projection size.
    300 inch vs 250 inch
  • Motorized focus
    This projector supports motorized focus, while the average projector does not. 45.6% of projectors support motorized focus.
  • Supports auto low-latency mode
    This projector switches to low-latency mode automatically, while the average projector does not. 16% of projectors offer this.
  • 19 ms lower input lag
    This projector has a lower input lag than the average projector (8 ms vs 27 ms). The average projector has 27 ms of input lag.
    At 1080P/240Hz.
    8 ms vs 27 ms
  • Supports motion smoothing
    This projector supports motion smoothing, while the average projector does not. 34.1% of projectors offer this.
  • Modern HDMI standard
    This projector offers Modern HDMI standard than the average projector (2.1 vs 2). The average projector supports HDMI 2.0.
    Different HDMI ports use 2.1 and 2.
    2.1 vs 2.0
  • 77.8% higher HDMI bandwidth
    This projector has a higher HDMI bandwidth than the average projector (32 Gbps vs 18 Gbps). The average projector has 18 Gbps of HDMI bandwidth.
    32 Gbps vs 18 Gbps
  • Supports HDMI ARC
    This projector supports HDMI ARC, while the average projector does not. 35.2% of projectors support HDMI ARC.
    Via eARC.
  • Has S/PDIF output
    This projector supports S/PDIF output, while the average projector does not. 16.6% of projectors support S/PDIF output.
    Optical S/PDIF.
  • Supports AirPlay
    This projector supports AirPlay, while the average projector does not. 40.3% of projectors offer this.
  • 1 more RJ45 ports
    This projector has more RJ45 ports than the average projector (1 vs 0). The average projector has 0 RJ45 ports.
    1 vs 0
  • 1 more HDMI ports
    This projector has more HDMI ports than the average projector (3 vs 2). The average projector has 2 HDMI ports.
    3 vs 2
  • 1 more USB ports
    This projector has more USB ports than the average projector (2 vs 1). The average projector has 1 USB ports.
    2 vs 1
  • Supports Miracast mirroring
    This projector supports Miracast, while the average projector does not. 46.4% of projectors offer this.
  • Supports smart TV apps
    This projector has built-in smart TV features, while the average projector does not. 43.9% of projectors offer smart TV features.
    Fire TV included.
  • 3x stronger audio output
    This projector has a higher audio output power than the average projector (30 W vs 10 W). The average projector has 10 W of audio output power.
    30 W vs 10 W
  • Includes stereo speakers
    This projector has stereo speakers, while the average projector does not. 47.8% of projectors have stereo speakers.
  • Laser light source
    This projector has a laser light source, while the average projector does not. 26.7% of projectors have one.
  • 3 dB quieter operation
    This projector has a lower audible noise than the average projector (28 dB vs 31 dB). The average projector has 31 dB of audible noise.
    28 dB vs 31 dB
  • 5,000 hours longer lamp life
    This projector has a higher lamp life than the average projector (25,000 hours vs 20,000 hours). The average projector has 20,000 hours of lamp life.
    25,000 hours vs 20,000 hours
  • Basic light source
    This projector has Basic light source than the average projector (hybrid vs laser). The average projector uses a laser light source.
    Tri-LED-Laser.
    hybrid vs laser
  • No RS-232 control
    This projector does not support RS-232 control, while the average projector does. 50.6% of projectors support RS-232 control.
  • 74.2% heavier weight
    This projector is heavier than the average projector (11.5 lb vs 6.6 lb). The average projector weighs 6.6 lb.
    11.5 lb vs 6.6 lb
  • 70 W higher power use
    This projector uses more power than the average projector (300 W vs 230 W). The average projector uses 230 W of power.
    300 W vs 230 W
  • 4.5 in taller body
    This projector is taller than the average projector (9.3 in vs 4.8 in). The average projector has a height of 4.8 in.
    9.3 in vs 4.8 in
  • 0.2 ft longer throw distance
    This projector has a higher throw distance than the average projector (3.5 ft vs 3.3 ft). The average projector has 3.3 ft of throw distance.
    3.5 ft vs 3.3 ft
  • 3.2 in thicker body
    This projector is thicker than the average projector (9.1 in vs 5.9 in). The average projector has a thickness of 5.9 in.
    9.1 in vs 5.9 in
  • 52.9% more expensive
    NexiGo TriVision Ultra is more expensive than the average projector ($1,300 vs $850).
    $1,300 vs $850
  • 52.9% more expensive
    NexiGo TriVision Ultra is more expensive than the average projector ($1,300 vs $850).
    $1,300 vs $850
  • 0.2 ft longer throw distance
    This projector has a higher throw distance than the average projector (3.5 ft vs 3.3 ft). The average projector has 3.3 ft of throw distance.
    3.5 ft vs 3.3 ft
  • No RS-232 control
    This projector does not support RS-232 control, while the average projector does. 50.6% of projectors support RS-232 control.
  • Basic light source
    This projector has Basic light source than the average projector (hybrid vs laser). The average projector uses a laser light source.
    Tri-LED-Laser.
    hybrid vs laser
  • 74.2% heavier weight
    This projector is heavier than the average projector (11.5 lb vs 6.6 lb). The average projector weighs 6.6 lb.
    11.5 lb vs 6.6 lb
  • 70 W higher power use
    This projector uses more power than the average projector (300 W vs 230 W). The average projector uses 230 W of power.
    300 W vs 230 W
  • 4.5 in taller body
    This projector is taller than the average projector (9.3 in vs 4.8 in). The average projector has a height of 4.8 in.
    9.3 in vs 4.8 in
  • 3.2 in thicker body
    This projector is thicker than the average projector (9.1 in vs 5.9 in). The average projector has a thickness of 5.9 in.
    9.1 in vs 5.9 in

Video Reviews

Hands-on testing, unboxing, and real-world video evaluations

8.0
SmartNest Tech
≈ estimated
23/06/2026
Hands-on review · picture, sound, gaming and setup
Verdict
NexiGo TriVision Ultra is sharp, bright and easy to live with, worth considering if you're happy using a streaming stick.
9.0
JoelsterG4K
≈ estimated
08/09/2025
Hands-on review · picture, gaming and 3D tests
Verdict
NexiGo TriVision Ultra is strong for gaming, HDR and 3D, though its blacks look lifted.
9.0
AP Tech
≈ estimated
21/07/2025
Hands-on review · daylight, cartoon and gaming tests
Verdict
NexiGo TriVision Ultra is a serious contender for portable home cinema, but it needs an external streaming stick.
Brand video
Not graded
Shop video

Expert Reviews

In-depth analysis and verdict from leading tech publications

5.8
rtings.com
✓ explicit
4/11/2025
Lab test · Bright DLP projector
Verdict
The NexiGo TriVision Ultra is bright and easy to set up, with usable 4K gaming, but gray blacks, cool colors and no built-in apps hold it back.
9.0
ce-sphere.com
≈ estimated
3/3/2027
Hands-on review · Lifestyle DLP projector
Verdict
The NexiGo TriVision Ultra is a very bright, sharp DLP projector for rooms with some light, but it has no built-in apps and dark-gray blacks.
5.8
rtings.com
✓ explicit
4/11/2025
Lab test · Bright DLP projector
Verdict
The NexiGo TriVision Ultra is bright and easy to set up, with usable 4K gaming, but gray blacks, cool colors and no built-in apps hold it back.

Third-Party Reviews

What Customers Like About NexiGo TriVision Ultra

  • Stunning 4K resolution and high brightness (2,600 lumens) allow for viewing in moderately lit rooms without getting washed out.
  • Exceptional color performance featuring a 110% BT.2020 gamut and out-of-the-box calibration report for high accuracy.
  • Excellent gaming capabilities with ultra-low latency (as low as 4ms) and support for 4K at 120Hz via HDMI 2.1.
  • Versatile high-dynamic-range support including both Dolby Vision and HDR10+ for refined scene-by-scene brightness adjustments.
  • Innovative hybrid Tri-LED-Laser light source virtually eliminates laser speckle and reduces eye fatigue during extended use.
  • User-friendly design featuring AI-driven autofocus, auto keystone correction, and a unique hidden storage slot for a Fire TV stick.

What Customers Don't Like About NexiGo TriVision Ultra

  • Weak native contrast in very dark scenes where blacks can appear lifted and content looks somewhat flat.
  • Lack of a built-in smart operating system, requiring an external streaming dongle for apps like Netflix or Disney+.
  • Inconsistent refresh rate performance, as 120Hz signals may experience frame skipping, effectively capping smooth output at 60Hz.
  • Built-in 30W speakers may lack the depth and volume necessary for large spaces or outdoor environments.
  • Noticeable fan noise during extended operation, which can sometimes distract from the viewing experience.
  • Bulky form factor compared to other portable projectors, making it slightly less convenient for frequent travel.

Verdict

The NexiGo TriVision Ultra is a 4K UHD portable DLP projector featuring a unique Tri-LED-Laser hybrid light source that delivers 2,600 ANSI lumens while eliminating common laser speckle. Its standout characteristics include comprehensive HDR support (Dolby Vision, HDR10+, and HLG), 110% BT.2020 color gamut coverage with factory-calibrated ΔE < 1 accuracy, and advanced AI smart adaptation for autofocus and obstacle avoidance. Key pros include an ultra-low gaming latency of 4.2ms to 8ms, 3D compatibility, dual 15W speakers with DTS Virtual:X, and a dedicated hidden compartment for streaming sticks. Notable cons include relatively low native contrast that results in lifted black levels in dark scenes, a lack of a built-in smart operating system, and high out-of-the-box color inaccuracy before calibration.

Compare NexiGo TriVision Ultra With Other Products in the Projectors Category

1Product to compare no. 1
VS
2Product to compare no. 2
VS
3Product to compare no. 3 (optional)

Graphic Comparison of NexiGo TriVision Ultra and Other Products in the Projectors Category

No results found