Scored using Projectors Methodology v3.0
Projectors Methodology v3.0
Mathematical & Unbiased Scoring
Products in this category are scored under Frontum Projectors Methodology v3.0: the technical score from the specifications is the base, and independent expert and video reviews (up to ±0.5 points), owner opinions (up to ±0.3) and best-of lists (up to +0.3) move it up or down.
Explore Projectors Methodology v3.0

ViewSonic X1000-4K Review: 86 Specs Compared

Avg. price:~$1,000Native panel resolution:3840x2160ANSI lumens:1000Throw ratio:0.25:1Lamp life:30000 hours

ViewSonic X1000-4K Review: Compare 86 technical specifications and 9 expert and video reviews to see how this product ranks in the Projectors category and whether it is worth buying.
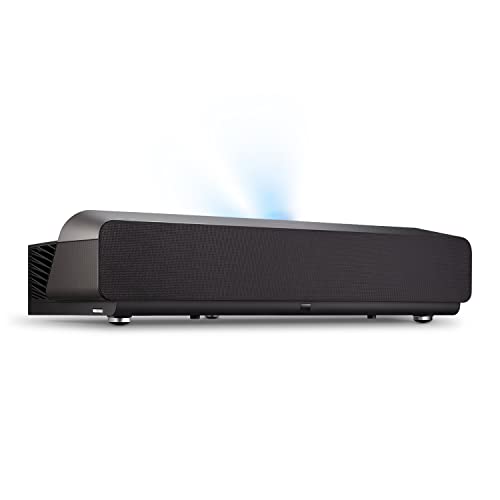
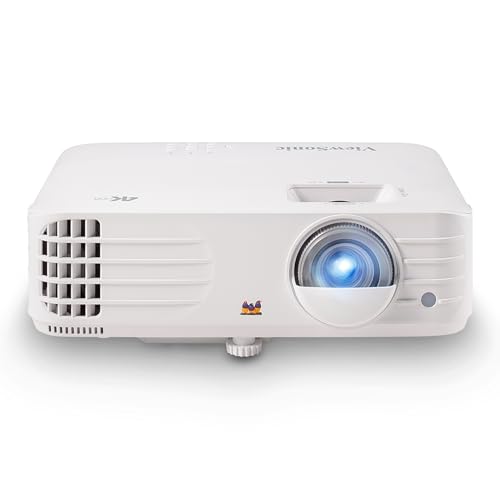
ViewSonic X1000-4K
7.5/10

Overall score

Score
7.5/ 10
✕
What it is
Our main score for this model, 1–10. It combines specs, best-of lists, expert reviews and owners.
How we count it
Parts: Technical score 35%, List score 30%, Reviews score 25%, Sentiment score 10%
Marks: Each part gets a mark out of 10. For reviews, lists and owners, a typical model in this category gets about 8 and the best one gets 10.
No data yet: A part with no data shows "?". It counts as the mark of a weaker model in this category (4 in 5 models with data score higher). This way, models with reviews, lists and owners usually come out ahead.
Score distribution
â–¼
<55-66-77-88-99-10
Score components

35%

7.0

Technical Score

30%

?

List scoreNot enough data yet, so we use 7.5, the mark of a weaker model in this category

25%

8.5

Reviews score

10%

?

Sentiment scoreNot enough data yet, so we use 6.8, the mark of a weaker model in this category

â–²Better than 73% of projectors
6.8

Ratio quality/price

Ratio quality/price
6.8/ 10
✕
What it is
An indicator that combines the projector's overall rating with its cost.
When it matters
When you are looking for a projector with a good balance between quality and price.
Score distribution
â–¼
<55-66-77-88-99-10
Score components

70%

7.5

Overall score

30%

5.2

Price

â–²Better than 54%
7.0

Technical Score

Technical score
7.0/ 10
✕
What it is
How good the specs are compared with the other models in this category, 1–10.
How we count it
Areas: We rate the specs in each area against the other models in this category.
Weighting: The areas that matter most to buyers count more. The shares are shown under Score components.
Share: The technical score is 35% of the overall score.
Score distribution
â–¼
<55-66-77-88-99-10
Score components

42%

7.5

Image Quality

22%

4.8

Projection & Lens

12%

6.6

HDMI & Gaming

10%

9.5

Audio & Features

8%

8.1

Connectivity

6%

7.2

Design & Power

â–²Better than 71%
8.5

Reviews score

Reviews score
8.5/ 10
✕
What it is
Average grade from independent test sites, magazines and video reviewers, 1–10.
How we count it
Grades: Each review's own score is converted to 1–10; without one, we grade the review ourselves. Big test sites count more, short reviews half as much as full tests. A video review counts half.
Score: The average grade is 80% of the review mark; the number of reviews is the other 20% (1 review = 5, the typical number in this category = 8, the most-reviewed model = 10).
Enough data: With few reviews, the average grade is pulled toward the typical grade of this category. No reviews yet: 7.8 for now.
Share: Reviews count 25% of the overall score.
Score distribution
â–¼
<55-66-77-88-99-10

80%

8.6

Average grade

20%

8.0

Popularity

Grades by review (9)
6 reviews: 4 with a printed score, 2 estimated from the review. 3 video reviews, each counting half as much as a written test. Reviews count 25% of the overall score.
User ratings collected online are not part of this score.
â–²Better than 72%
?

Sentiment score

Sentiment score
6.8/ 10
✕
What it is
How positive owners are about this model in their comments under video reviews and on forums. We read each comment, keep only people who say they own the model, and sort them into positive, mixed or negative.
How we count it
Score: We compare how satisfied this model’s owners are with the other models in this category: the typical model gets 8, the most satisfied tenth 10, the least satisfied 4. This is 80% of the owner mark; the number of owners is the other 20%.
Enough data: A model counts with 10+ owners from 4+ different discussions. With fewer, the owner part counts as 6.8 for now.
Share: Owners count 10% of the overall score (left out in categories where fewer than 10 models have enough owner comments).
Score distribution
â–¼
<55-66-77-88-99-10
Owners (12)
Not enough owner comments yet (10+ owners from 4+ discussions needed), so the owner part counts as 6.8 for now.
Our own analysis of online owner opinions, not a rating from any website.
Not enough owner comments yet
?

List score

List score
7.5/ 10
✕
What it is
How often independent test sites, magazines and video reviewers put this model in their best-of lists for this category.
How we count it
Points: The model in the most lists of this category gets 10; the others get 8 to 10 in proportion. In no list yet: 7.5. Lists count 30% of the overall score.
Enough data: Every list counts, even a single one. With fewer than 5 best-of lists in the category, this part is left out.
Lists with this model (0)
Not in any best-of list yet, so this part counts as 7.5. Models in a list get 8 to 10.
Not in any best-of list yet
  • viewsonic-x1000-4k
  • viewsonic-x1000-4k
  • viewsonic-x1000-4k
  • viewsonic-x1000-4k
  • viewsonic-x1000-4k
  • viewsonic-x1000-4k
  • viewsonic-x1000-4k
  • viewsonic-x1000-4k
  • viewsonic-x1000-4k
  • viewsonic-x1000-4k
viewsonic-x1000-4k
viewsonic-x1000-4k
viewsonic-x1000-4k
viewsonic-x1000-4k
viewsonic-x1000-4k
viewsonic-x1000-4k
viewsonic-x1000-4k
viewsonic-x1000-4k
viewsonic-x1000-4k
viewsonic-x1000-4k
Where to Buy
*As an Amazon Associate, we earn from qualifying purchases.

What Reviewers Say About the ViewSonic X1000-4K

Based on 7 · 3

Reviewers love the rich built-in speakers and flexible throw distance, but the apps and software let it down.
Praised
Criticised
Pick a topic to see who said what
Loading...
Loading category ranking...

Technical Specifications of Projector ViewSonic X1000-4K

Technical Score
Technical score
7.0/ 10
✕
What it is
How good the specs are compared with the other models in this category, 1–10.
How we count it
Areas: We rate the specs in each area against the other models in this category.
Weighting: The areas that matter most to buyers count more. The shares are shown under Score components.
Share: The technical score is 35% of the overall score.
Score distribution
â–¼
<55-66-77-88-99-10
Score components:

42%

7.5

Image Quality

22%

4.8

Projection & Lens

12%

6.6

HDMI & Gaming

10%

9.5

Audio & Features

8%

8.1

Connectivity

6%

7.2

Design & Power

7.0
Reviews score
8.5
Sentiment score
?
List score
?
Ratio quality/price
Value for money
6.8/ 10
✕
What it is
An indicator that combines the projector's overall rating with its cost.
When it matters
When you are looking for a projector with a good balance between quality and price.
Score distribution
â–¼
<55-66-77-88-99-10
Score components:

70%

7.5

Overall score

30%

5.2

Price

6.8
ANSI lumens
1,000
This projector reaches 1,000 ANSI lumens, dimmer than 67.1% of projectors and equal to 2.6% of projectors.
Contrast ratio
3,000,000:1
This projector has a contrast ratio of 3000000:1, higher than 93.1% of projectors and equal to 4.5% of projectors.
Dynamic contrast ratio.
Native panel resolution
3840x2160
This projector uses a native resolution of 3840x2160, higher than 91.1% of projectors and equal to 4.7% of projectors.
Output resolution
3840x2160
This projector supports output resolution up to 3840x2160, higher than 71.2% of projectors and equal to 24.6% of projectors.
Projection technology
DLP
Show more
What reviewers say
Throw ratio
0.25:1
Min throw distance
0.5 ft
This projector needs a minimum throw distance of 0.5 ft, shorter than 96.7% of projectors and equal to 0.4% of projectors.
Max projection size
150 inch
This projector supports projection sizes up to 150 inch, smaller than 67.2% of projectors and equal to 10.2% of projectors.
Zoom ratio
N/A
Motorized zoom
no
This projector does not have motorized zoom. 14.8% of projectors offer this.
Show more
What reviewers say
Input lag
66 ms
This projector has input lag of 66 ms, higher than 88.9% of projectors and equal to 0.6% of projectors.
At 4K/60Hz.
Auto low latency mode (ALLM)
no
This projector does not switch to low-latency mode automatically. 16.1% of projectors offer this.
Variable refresh rate (VRR)
no
This projector does not support variable refresh rate. 1.8% of projectors offer this.
HDMI version
2
This projector supports HDMI 2, more modern than 46.1% of projectors and equal to 35.9% of projectors.
Max HDMI bandwidth
18 Gbps
This projector supports HDMI bandwidth up to 18 Gbps, higher than 48.9% of projectors and equal to 39.7% of projectors.
Show more
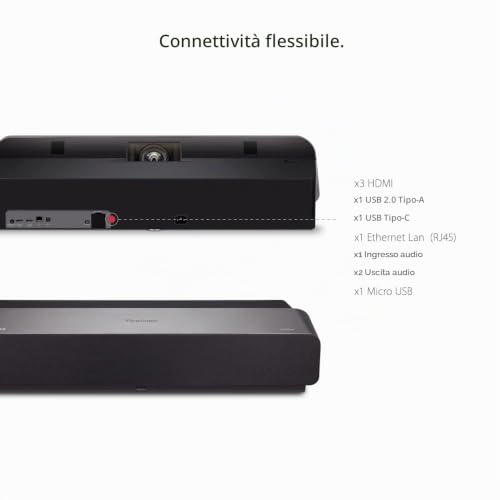
N. of HDMI ports
3
This projector has 3 HDMI port/s, more than 93.3% of projectors and equal to 6.4% of projectors.
Wi-Fi connectivity
yes
This projector connects to Wi-Fi networks for streaming. 46.7% of projectors offer this.
Wi-Fi version
Wi-Fi 5 (802.11ac)
This projector uses Wi-Fi 5 (802.11ac), which is newer than 55.6% of projectors and the same as in 27.5% of projectors.
Bluetooth connectivity
yes
This projector supports Bluetooth for speakers and headphones. 49.4% of projectors offer this.
Bluetooth version
4
This projector supports Bluetooth 4, more modern than 53.5% of projectors and equal to 2.4% of projectors.
Show more
What reviewers say
Smart TV features
yes
This projector has built-in smart TV features. 56.2% of projectors offer this.
Operating system
proprietary
Android OS
no
This projector does not run Android OS. 19.1% of projectors run Android OS.
Dedicated smartphone app
yes
This projector comes with a dedicated smartphone app. 63.3% of projectors come with a dedicated smartphone app.
ViewSonic vCastSender app.
Remote control
yes
This projector includes a remote control. 1.5% of projectors offer this.
Show more
What reviewers say
Light source type
led
This projector uses led light source technology, more advanced than 33.6% of projectors and equal to 39.9% of projectors.
Laser light source
no
This projector does not have a laser light source. 26.8% of projectors offer this.
Lamp life
30,000 hours
This projector offers lamp life of 30,000 hours, shorter than 67.9% of projectors and equal to 25.9% of projectors.
LED light source life.
Lamp life (eco mode)
30,000 hours
This projector offers eco-mode lamp life of 30,000 hours, shorter than 64% of projectors and equal to 31.9% of projectors.
Eco mode rating.
Operating power consumption
200 W
This projector uses 200 W of power, less than 53.3% of projectors and equal to 1% of projectors.
Show more
What reviewers say

ViewSonic X1000-4K vs the Average Projector

246810TotalImage QualityProjection & LensHDMI & GamingConnectivityAudio & FeaturesDesign & Power
  • Higher contrast ratio
    This projector has a higher contrast ratio than the average projector (3000000:1 vs 10000:1). The average projector has 10000:1 of contrast ratio.
    Dynamic contrast ratio.
    3,000,000:1 vs 10,000:1
  • High native resolution
    This projector has a higher native panel resolution than the average projector (3840x2160 vs 1920x1080). The average projector has a native panel resolution of 1920x1080.
    3840x2160 vs 1920x1080
  • Higher output resolution
    This projector supports a higher output resolution than the average projector (3840x2160 vs 1920x1080). The average projector outputs at 1920x1080 resolution.
    3840x2160 vs 1920x1080
  • 2.8 ft shorter throw distance
    This projector has a lower throw distance than the average projector (0.5 ft vs 3.3 ft). The average projector has 3.3 ft of throw distance.
    0.5 ft vs 3.3 ft
  • Supports pixel shifting
    This projector supports pixel shifting, while the average projector does not. 26.6% of projectors support pixel shifting.
  • 4x stronger audio output
    This projector has a higher audio output power than the average projector (40 W vs 10 W). The average projector has 10 W of audio output power.
    40W soundbar.
    40 W vs 10 W
  • Supports smart TV apps
    This projector has built-in smart TV features, while the average projector does not. 43.9% of projectors offer smart TV features.
  • 3 more USB ports
    This projector has more USB ports than the average projector (4 vs 1). The average projector has 1 USB ports.
    4 vs 1
  • 14.9% higher review score
    Reviews score
    8.5/ 10
    ✕
    What it is
    Average grade from independent test sites, magazines and video reviewers, 1–10.
    How we count it
    Grades: Each review's own score is converted to 1–10; without one, we grade the review ourselves. Big test sites count more, short reviews half as much as full tests. A video review counts half.
    Score: The average grade is 80% of the review mark; the number of reviews is the other 20% (1 review = 5, the typical number in this category = 8, the most-reviewed model = 10).
    Enough data: With few reviews, the average grade is pulled toward the typical grade of this category. No reviews yet: 7.8 for now.
    Share: Reviews count 25% of the overall score.
    Score distribution
    â–¼
    <55-66-77-88-99-10

    80%

    8.6

    Average grade

    20%

    8.0

    Popularity

    Grades by review (9)
    6 reviews: 4 with a printed score, 2 estimated from the review. 3 video reviews, each counting half as much as a written test. Reviews count 25% of the overall score.
    User ratings collected online are not part of this score.
    8.5 vs 7.4
  • Higher contrast ratio
    This projector has a higher contrast ratio than the average projector (3000000:1 vs 10000:1). The average projector has 10000:1 of contrast ratio.
    Dynamic contrast ratio.
    3,000,000:1 vs 10,000:1
  • High native resolution
    This projector has a higher native panel resolution than the average projector (3840x2160 vs 1920x1080). The average projector has a native panel resolution of 1920x1080.
    3840x2160 vs 1920x1080
  • Higher output resolution
    This projector supports a higher output resolution than the average projector (3840x2160 vs 1920x1080). The average projector outputs at 1920x1080 resolution.
    3840x2160 vs 1920x1080
  • Supports pixel shifting
    This projector supports pixel shifting, while the average projector does not. 26.6% of projectors support pixel shifting.
  • Wider color gamut
    This projector has a higher color gamut coverage than the average projector (125% Rec.709 % vs 99% Rec.709 %). The average projector has 99% Rec.709 % of color gamut coverage.
    125% Rec.709 % vs 99% Rec.709 %
  • Supports HLG
    This projector supports HLG, while the average projector does not. 41.2% of projectors support HLG.
  • 2.8 ft shorter throw distance
    This projector has a lower throw distance than the average projector (0.5 ft vs 3.3 ft). The average projector has 3.3 ft of throw distance.
    0.5 ft vs 3.3 ft
  • Advanced focus control
    This projector offers Advanced focus control than the average projector (motorized vs manual). The average projector uses manual focus control.
    motorized vs manual
  • Motorized focus
    This projector supports motorized focus, while the average projector does not. 45.6% of projectors support motorized focus.
  • Supports motion smoothing
    This projector supports motion smoothing, while the average projector does not. 34.1% of projectors offer this.
  • 3 more USB ports
    This projector has more USB ports than the average projector (4 vs 1). The average projector has 1 USB ports.
    4 vs 1
  • Has S/PDIF output
    This projector supports S/PDIF output, while the average projector does not. 16.6% of projectors support S/PDIF output.
    Optical S/PDIF.
  • 1 more RJ45 ports
    This projector has more RJ45 ports than the average projector (1 vs 0). The average projector has 0 RJ45 ports.
    1 vs 0
  • More advanced USB ports
    This projector has faster USB ports than the average projector (USB 3.2 Gen 1 vs USB 2).
    Also includes USB 2 ports.
    USB 3.2 Gen 1 vs USB 2.0
  • 1 more HDMI ports
    This projector has more HDMI ports than the average projector (3 vs 2). The average projector has 2 HDMI ports.
    3 vs 2
  • Supports Miracast mirroring
    This projector supports Miracast, while the average projector does not. 46.4% of projectors offer this.
  • 4x stronger audio output
    This projector has a higher audio output power than the average projector (40 W vs 10 W). The average projector has 10 W of audio output power.
    40W soundbar.
    40 W vs 10 W
  • Supports smart TV apps
    This projector has built-in smart TV features, while the average projector does not. 43.9% of projectors offer smart TV features.
  • Smartphone app support
    This projector supports smartphone app control, while the average projector does not. 36.7% of projectors support smartphone app control.
    ViewSonic vCastSender app.
  • Includes stereo speakers
    This projector has stereo speakers, while the average projector does not. 47.8% of projectors have stereo speakers.
  • Supports voice commands
    This projector supports voice commands, while the average projector does not. 36.1% of projectors support voice commands.
    Alexa and Google Assistant supported.
  • 1 more audio input ports
    This projector has more audio input ports than the average projector (1 vs 0). The average projector has 0 audio input ports.
    1 vs 0
  • 6 dB quieter operation
    This projector has a lower audible noise than the average projector (25 dB vs 31 dB). The average projector has 31 dB of audible noise.
    25 dB vs 31 dB
  • 5 dB quieter eco mode
    This projector has a lower audible noise in eco mode than the average projector (23 dB vs 28 dB). The average projector has 28 dB of audible noise in eco mode.
    23 dB vs 28 dB
  • 10,000 hours longer lamp life
    This projector has a higher lamp life than the average projector (30,000 hours vs 20,000 hours). The average projector has 20,000 hours of lamp life.
    LED light source life.
    30,000 hours vs 20,000 hours
  • 10,000 hours longer eco lamp life
    This projector has a higher lamp life in eco mode than the average projector (30,000 hours vs 20,000 hours). The average projector has 20,000 hours of lamp life in eco mode.
    LED light source life.
    30,000 hours vs 20,000 hours
  • 54.5% dimmer image
    This projector has lower ANSI lumens than the average projector (1,000 vs 2,200). The average projector has 2,200 ANSI lumens.
    1,000 vs 2,200
  • Basic light source
    This projector has Basic light source than the average projector (led vs laser). The average projector uses a laser light source.
    led vs laser
  • 39 ms higher input lag
    This projector has a higher input lag than the average projector (66 ms vs 27 ms). The average projector has 27 ms of input lag.
    At 4K/60Hz.
    66 ms vs 27 ms
  • 100 inch smaller image size
    This projector has a lower projection size than the average projector (150 inch vs 250 inch). The average projector has 250 inch of projection size.
    150 inch vs 250 inch
  • Limited HDMI format
    This projector supports a less capable max HDMI input format than the average projector (4K/60Hz vs 4K/120Hz). The average projector supports a max HDMI input format of 4K/120Hz.
    4K/60Hz vs 4K/120Hz
  • 16 degrees less vertical correction
    This projector offers less vertical keystone correction than the average projector (14 degrees vs 30 degrees). The average projector offers vertical keystone correction of 30 degrees.
    14 degrees vs 30 degrees
  • 3.15x heavier weight
    This projector is heavier than the average projector (20.8 lb vs 6.6 lb). The average projector weighs 6.6 lb.
    20.8 lb vs 6.6 lb
  • 18.1 in wider body
    This projector is wider than the average projector (29.8 in vs 11.7 in). The average projector has a width of 11.7 in.
    29.8 in vs 11.7 in
  • 54.5% dimmer image
    This projector has lower ANSI lumens than the average projector (1,000 vs 2,200). The average projector has 2,200 ANSI lumens.
    1,000 vs 2,200
  • 100 inch smaller image size
    This projector has a lower projection size than the average projector (150 inch vs 250 inch). The average projector has 250 inch of projection size.
    150 inch vs 250 inch
  • 16 degrees less vertical correction
    This projector offers less vertical keystone correction than the average projector (14 degrees vs 30 degrees). The average projector offers vertical keystone correction of 30 degrees.
    14 degrees vs 30 degrees
  • 39 ms higher input lag
    This projector has a higher input lag than the average projector (66 ms vs 27 ms). The average projector has 27 ms of input lag.
    At 4K/60Hz.
    66 ms vs 27 ms
  • Limited HDMI format
    This projector supports a less capable max HDMI input format than the average projector (4K/60Hz vs 4K/120Hz). The average projector supports a max HDMI input format of 4K/120Hz.
    4K/60Hz vs 4K/120Hz
  • Basic light source
    This projector has Basic light source than the average projector (led vs laser). The average projector uses a laser light source.
    led vs laser
  • 3.15x heavier weight
    This projector is heavier than the average projector (20.8 lb vs 6.6 lb). The average projector weighs 6.6 lb.
    20.8 lb vs 6.6 lb
  • 18.1 in wider body
    This projector is wider than the average projector (29.8 in vs 11.7 in). The average projector has a width of 11.7 in.
    29.8 in vs 11.7 in
  • 5.6 in thicker body
    This projector is thicker than the average projector (11.5 in vs 5.9 in). The average projector has a thickness of 5.9 in.
    11.5 in vs 5.9 in
  • 1.9 in taller body
    This projector is taller than the average projector (6.7 in vs 4.8 in). The average projector has a height of 4.8 in.
    6.7 in vs 4.8 in

Video Reviews

Hands-on testing, unboxing, and real-world video evaluations

9.0
Siddharth Vlogs
≈ estimated
01/02/2022
Long-term test · PS5 gaming and 140-inch picture
Verdict
ViewSonic X1000-4K has a vivid, sharp picture and excellent sound for gaming and movies, but its built-in apps fall short, so add a streaming device.
9.0
GreatLobbyist
≈ estimated
23/12/2021
Personal use review · daily home use and built-in apps
Verdict
ViewSonic X1000-4K is praised as a TV replacement that suits the room's look and works well for family use.
8.0
all things tech
≈ estimated
18/09/2021
Hands-on review · picture, sound and gaming tests
Verdict
ViewSonic X1000-4K is recommended for budget buyers, though placement is fiddly and it lacks zoom and lens shift.
Brand video

Expert Reviews

In-depth analysis and verdict from leading tech publications

9.0
me.pcmag.com
✓ explicit
8/12/2021
Hands-on review · Ultra-short throw
Verdict
The ViewSonic X1000-4K is a loud ultra-short throw projector that can replace a TV, but you have to position it yourself.
9.0
hindustantimes.com
≈ estimated
6/12/2022
Hands-on review · TV alternative
Verdict
The ViewSonic X1000-4K is a strong TV alternative for sport and movies, with a built-in soundbar, but its app setup is clumsy without a streaming stick.
8.0
thehindu.com
≈ estimated
3/1/2023
Hands-on review · TV replacement
Verdict
The ViewSonic X1000-4K makes a good home cinema with sharp HDR, but its app center is weak and Netflix and Prime Video failed in testing.
9.0
hifitest.de
✓ explicit
12/3/2022
Lab test · Ultra-short throw
Verdict
The ViewSonic X1000-4K is a bright ultra-short throw projector with a soundbar that fills a 6.6 ft wide picture from about 20 in, but needs calibration out of the box.
9.8
lite-magazin.de
✓ explicit
5/11/2022
Hands-on test · Smart projector
Verdict
The ViewSonic X1000-4K is a bright smart projector that throws a 100-inch picture from a sideboard, but edges soften and dark scenes look lifted.
7.4
audiovision.de
✓ explicit
5/3/2024
Lab test · Soundbar projector
Verdict
The ViewSonic X1000-4K is a bright TV alternative with good sound for big screens, but its black levels fall short of flat-screen TVs.

Third-Party Reviews

What Customers Like About ViewSonic X1000-4K

  • Excellent built-in 40W Harman Kardon soundbar that is loud enough to replace external speakers.
  • Stunning 4K visual quality with vibrant colors (125% Rec.709).
  • Ultra Short Throw (UST) capability allows for a 100-inch screen from just 15 in away.
  • Long-lasting LED light source rated for up to 30,000 hours, eliminating the need for bulb replacements.
  • Silent operation with fan noise as low as 20–25 decibels.
  • Sleek, award-winning minimalist design that integrates well into modern living spaces.

What Customers Don't Like About ViewSonic X1000-4K

  • Terrible, 'clunky' built-in Android-based smart software and App Store.
  • Lack of essential adjustment features such as optical zoom, lens shift, or horizontal keystone.
  • Difficult user interface that often requires a mouse or mobile app to navigate successfully.
  • Poor implementation of pre-installed streaming apps like Netflix and Prime Video, which often fail to work correctly.
  • Input lag (66ms - 134ms) may be too high for competitive or 'hard-core' gaming.
  • Requires extremely precise placement to achieve a square image due to the lack of digital correction tools.

Verdict

The ViewSonic X1000-4K is an ultra-short throw (0.25 throw ratio) LED soundbar projector that delivers native 4K UHD resolution (3840x2160) with HDR support and 2,400 LED lumens of brightness. Its second-generation LED light source offers a 30,000-hour lifespan and covers 125% of the Rec.709 color gamut through Cinema SuperColor+ technology. Key features include a built-in 40W Harman Kardon soundbar, 12GB of internal storage, and smart connectivity via Wi-Fi and Bluetooth. While it provides high-quality audiovisuals and easy setup near walls, its main drawbacks include a lack of optical zoom, lens shift, or horizontal keystone correction, a relatively high 66ms input lag for gaming, and a laggy smart interface.

Compare ViewSonic X1000-4K With Other Products in the Projectors Category

1Product to compare no. 1
VS
2Product to compare no. 2
VS
3Product to compare no. 3 (optional)

Graphic Comparison of ViewSonic X1000-4K and Other Products in the Projectors Category

No results found